
Editor’s note: Astrobites is a graduate-student-run organization that digests astrophysical literature for undergraduate students. As part of the partnership between the AAS and astrobites, we occasionally repost astrobites content here at AAS Nova. We hope you enjoy this post from astrobites; the original can be viewed at astrobites.org.
Title: Anomalously low metallicity regions in MaNGA star-forming galaxies: Accretion caught in action?
Author: Hsiang-Chih Hwang et al.
First Author’s Institution: Johns Hopkins University
Status: Accepted to AJ
Looking at a galaxy, the first thing we are likely to notice is its stars. All stars — whether they are massive, bright, short-lived blue stars or small, dim, long-lived red stars — form in regions called stellar nurseries, which are pockets of cold, dense molecular gas. Given the correct conditions, this gas will collapse and begin to form stars. Consequently, the abundance of gas within a galaxy can be treated as a measure of its ability to form stars. A problem arises though: given the rate of star formation observed in the nearby universe (0.3–1 solar masses per year), most galaxies should run out of gas quite quickly and, once this fuel is depleted, should stop forming stars completely. Obviously these galaxies are somehow acquiring gas, but it is very difficult to observe accretion, the gravitationally induced collection of gas by a galaxy (or other objects). Thus, there are many remaining questions regarding how galaxies accrete gas and at what rate. The authors of today’s paper examine galaxies for signs of recent gas accretion and examine correlations with galaxy properties and apparent instigators of accretion.
It’s Pronounced MaNGA: Data and Metrics
In this study, the authors start with a specific assumption: That gas observed to have unusually low metallicity, or metal content, is evidence that the galaxy has recently accreted metal-poor gas from some external gas reservoir. But to distinguish the metallicity of the gas from the metallicity of the galaxy itself, the authors need to have spatially resolved observations to work with. To accomplish this, the study utilizes data from the Mapping Nearby Galaxies at Apache Point Observatory (MaNGA) survey, which uses Integral Field Units (IFUs) to observe galaxies in the Sloan Digital Sky Survey (SDSS)-IV (read more about how MaNGA and IFUs work). Generally, an individual IFU obtains the spectrum of a small region within a galaxy and the resultant spectral pixel is called a spaxel. When all spaxels are mapped out (see the right two panels in Figure 1), astronomers can examine varying spectral properties over the surface of an entire galaxy.
Using the information from each spaxel, the authors calculate the expected metallicity for a region based on the measured stellar surface mass density (the number of stars in a specific area), and compare it to the observed metallicity of the same region. They identify gas that deviates more than 0.14 dex from expectations to be anomalously low metallicity (ALM) gas, and investigate how the presence of ALM gas correlates with several global galaxy properties, among them the stellar mass, NUV-r color, and the asymmetry. The NUV-r color describes the difference in brightness between the near ultraviolet (NUV) and red (r) light emitted by the galaxy, and roughly measures whether a galaxy is dominated by recently-formed, blue stars (a low NUV-r value) or old, red stars (a high NUV-r value). This color can also be used to calculate the specific star formation rate (sSFR) which indicates how quickly a galaxy is forming stars. The asymmetry of a galaxy is determined by comparing an image of a galaxy with the same image rotated by 180 degrees. A galaxy that is highly asymmetric is likely to be gravitationally interacting with another nearby galaxy, and therefore appears to be “strongly disturbed” in shape.
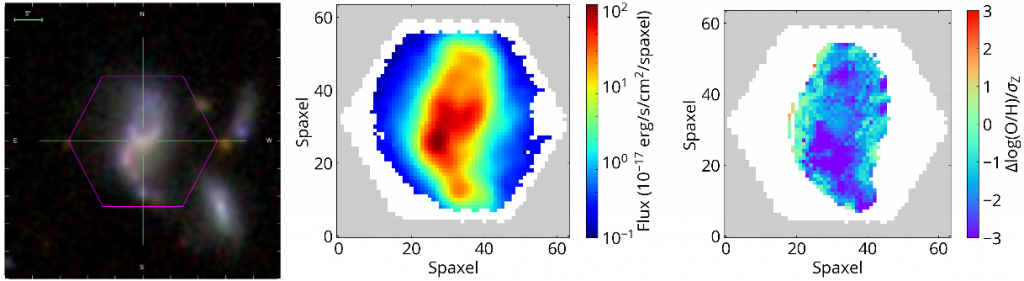
Figure 1: Example measurements from a galaxy showing ALM gas. Left: Galaxy in optical light from SDSS. Middle: Maps of Hα brightness, which is an indicator of star formation. Right: Deviation from the anticipated metallicity based on the stellar surface mass density. Dark blue and purple pixels indicate ALM gas. [Hwang et al. 2019]
Deviations from Normal Star-Forming Galaxies
Are galaxies with ALM gas unusual compared to other star forming galaxies? The answer is…yes! The ALM-containing galaxies are bluer in NUV-r color, more asymmetric, and have lower overall stellar masses than the rest of the sample of star-forming MaNGA galaxies. Although each of these results are important, the asymmetry is perhaps the most interesting. While ALM galaxies are more asymmetric on average, the majority of galaxies with ALM gas are not asymmetric. In other words, selecting an asymmetric galaxy will probably find you one with ALM gas, but the opposite will not be true. Nonetheless, this relationship suggests a connection between galaxy asymmetry and recent accretion of ALM gas (Figure 2).
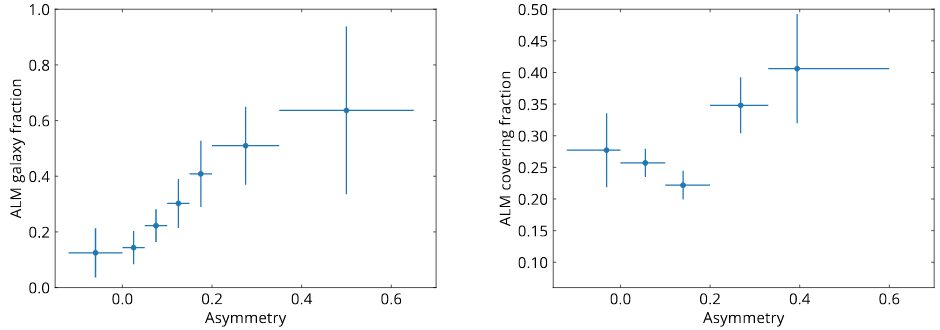
Figure 2: Relationships between the ALM gas in MaNGA galaxies. Left panel: The fraction of galaxies with ALM gas increases as the asymmetry measure increases. Right panel: The fraction of galaxy spaxels with ALM gas (for individual galaxies) increases as asymmetry measure of the galaxy increases. [Hwang et al. 2019]
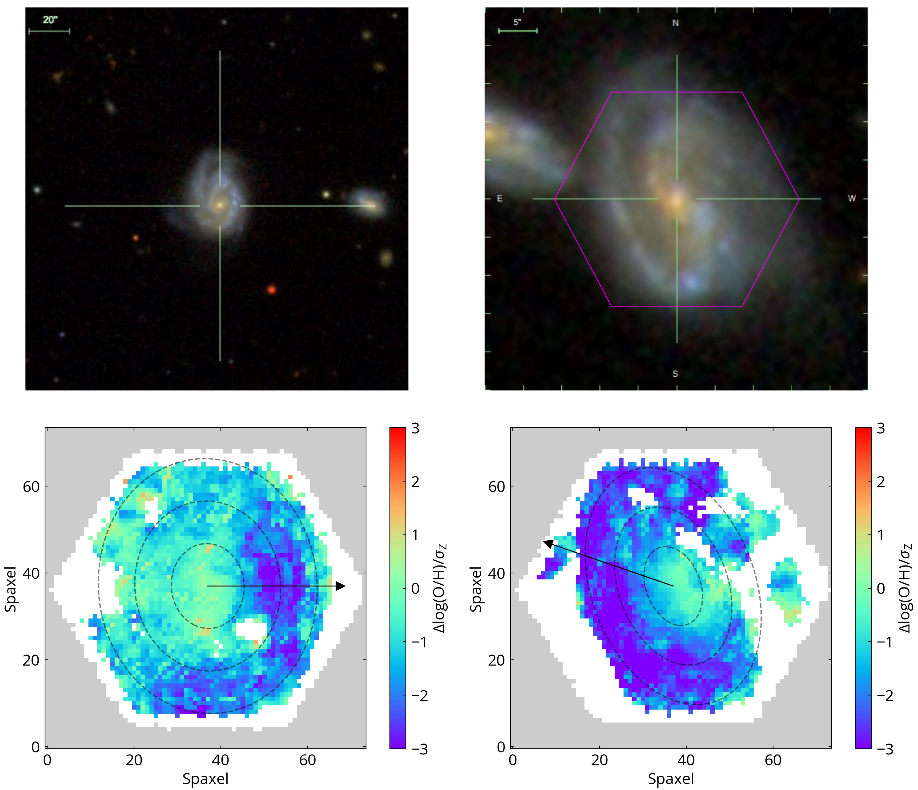
Figure 3: Top row: Optical SDSS images of two MaNGA galaxies with a “close-pair” companion. Bottom row: Spatial deviation from the expected metallicity, where dark blue or purple indicates ALM gas. Arrows show the direction to the companion galaxy. [Hwang et al. 2019]
Lifetime of ALM Gas
In addition to the association with companion galaxies, the authors find a clever way to determine how long an ALM region can last within a galaxy. The oxygen-based metallicity measurements will be altered once very massive O-type stars, greater than 8 solar masses, go supernova and begin enriching the surrounding interstellar medium with oxygen they created after leaving the main sequence. Using the short lifetimes (less than 30 million years) of these stars, the authors are able to calculate that an ALM region should be polluted by the stars it forms within a few hundred million years of the onset of star formation. Further, by estimating the mass of ALM material available in each spaxel of the MaNGA images, it is calculated that these star-forming galaxies likely undergo an accretion event roughly once every billion years, accumulating one billion solar masses of ALM gas for every event. Whether the accreted gas stems from a merger or removal of gas from a satellite galaxy, this averages out to 1 solar mass of gas accumulated every year, which accounts perfectly for the 0.3–1 solar masses per year of star formation rate observed in our local universe. Thus, this study shows that nearby galaxies are accreting a feasible amount of gas and suggests that mergers play an important — but not all-encompassing — role in sustaining star formation in galaxies.
About the author, Caitlin Doughty:
I am a fourth year graduate student at New Mexico State University. I use cosmological simulations to study galaxy evolution during the epoch of reionization, with a focus on metal absorption in the circumgalactic medium.
1 Comment
Pingback:AAS Nova – New