: Two Sub-Populations of Type Ia Supernovae?")
Editor’s note: Astrobites is a graduate-student-run organization that digests astrophysical literature for undergraduate students. As part of the partnership between the AAS and astrobites, we occasionally repost astrobites content here at AAS Nova. We hope you enjoy this post from astrobites; the original can be viewed at astrobites.org!
Title: Red vs Blue: Early observations of thermonuclear supernovae reveal two distinct populations?
Authors: Maximilian Stritzinger, Benjamin Shappee, Anthony Piro, et al.
First Author’s Institution: Aarhus University, Denmark
Status: Submitted to ApJ
Type Ia (pronounced “one-A”) supernovae are powerful explosions caused by a stellar remnant known as a white dwarf undergoing runaway nuclear fusion so violent that it blows the star apart. They are an important part of astronomy, as they can help astronomers estimate distances to far-away galaxies. (In fact, observations of Type Ia supernovae led to the 2011 Nobel Prize in physics for the discovery of the acceleration of the expansion of the universe.)
Type Ia supernovae are useful because we can use them as standardizable candles — objects whose inherent luminosity we can figure out based on various properties such as how long it takes for them to fade after brightening. Once we know their luminosity (how much light they actually emit) we can calculate their distance by measuring their brightness (how much light we measure from them here on Earth) and applying the inverse-square law. Actually figuring out their luminosity requires some care, however. We think that Type Ia supernovae can happen in at least two different ways (see this bite from 2012 for an explanation), and astronomers using them for distance measurements need to make various empirical corrections in order to do so.
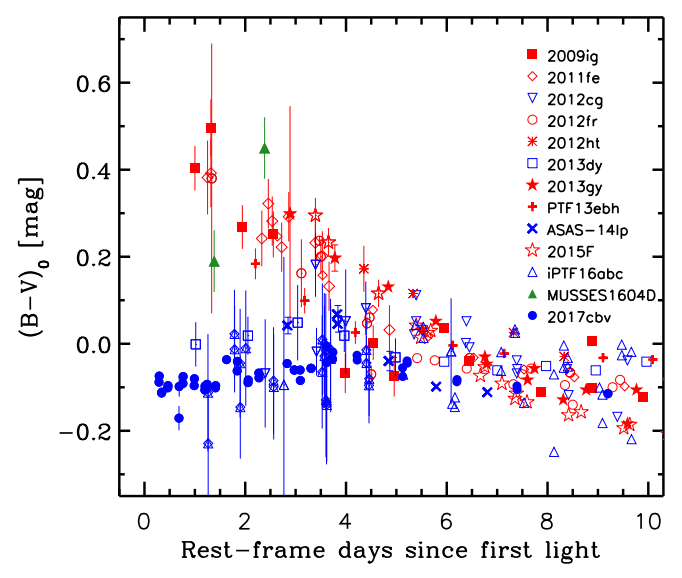
Figure 1: This plot shows the light curves of the thirteen supernovae examined in the paper. The red and blue colors show the “Red” and “Blue” populations and how their light curves diverge within the first four days since exploding. All light curves have been normalized to correct for reddening and time-dilation. [Stritzinger et al. 2018]
The authors present four possible explanations for why these two distinct populations may exist: interaction with a stellar companion, the presence of radioactive nickel-56 in the outer layers of the star*, interactions with the circumstellar medium (gas and dust around the star), and simple differences between the composition or opacity of the progenitor white dwarfs. They note, however, that none of these explanations completely explain all the evidence, so we still have more to learn about these intriguing explosions.
Part of the problem is the small number of objects to work with. Although there are hundreds of Type Ia supernovae known, most of them aren’t caught soon enough after the initial explosion to see the dichotomy found in today’s paper, as it only shows up very early on. This situation should be remedied in the future, however, as more — and more sensitive — automated surveys come online that will enable us to find more supernovae sooner after their initial explosions.
*It bears noting that much of the light in the later stages of a Type Ia supernova’s lightcurve comes from the decay of large amounts of radioactive nickel-56 (and iron-56 and cobalt-56) created during the explosion. However, this nickel-56 would have been created from material deep in the interior of the white dwarf. The proposed explanation involves nickel-56 existing in the outer layers of the white dwarf very soon after the start of the explosion, perhaps from being dredged up from the center due to strong mixing or from being created by a double-degenerate merger where two white dwarfs collide and explode.

Examples of supernovae in the authors’ early red vs. blue sample, with the supernovae positions indicated by stars. [Stritzinger et al. 2018]
About the author, Daniel Berke:
I’m a first-year grad student at Swinburne University of Technology in Melbourne, where I search for variation in the fine-structure constant on the galactic scale. When I’m not at uni I enjoy a variety of creative enterprises including photography, blogging, and video editing, or just relaxing with a good video game or some classical music.