
Observations of the protoplanetary disks that surround young stars provide crucial information about the initial conditions for planet formation. In a recent study, a team of scientists has proposed a novel new approach for determining disk properties from observations.
Limitations to Direct Measurement
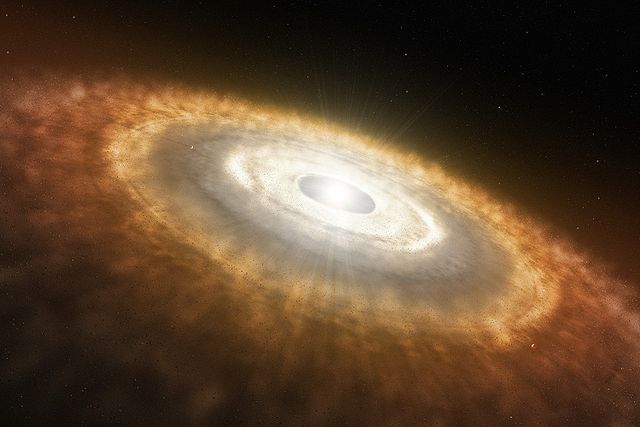
Artist’s impression of a protoplanetary disk surrounding a young star. [ESO/L. Calçada]
Instead, disk surface densities are inferred by measuring other components of the disk, like dust or molecules like CO or HD, and then making assumptions about the molecular abundances or the dust-to-gas ratio in the disk. Disk surface density estimates are therefore heavily dependent upon the assumptions that went into them.
Now, a team of scientists led by Diana Powell (University of California Santa Cruz) has proposed a new technique in which observations of a disk in different wavelengths can be used to determine its surface density profile without the need for such assumptions.
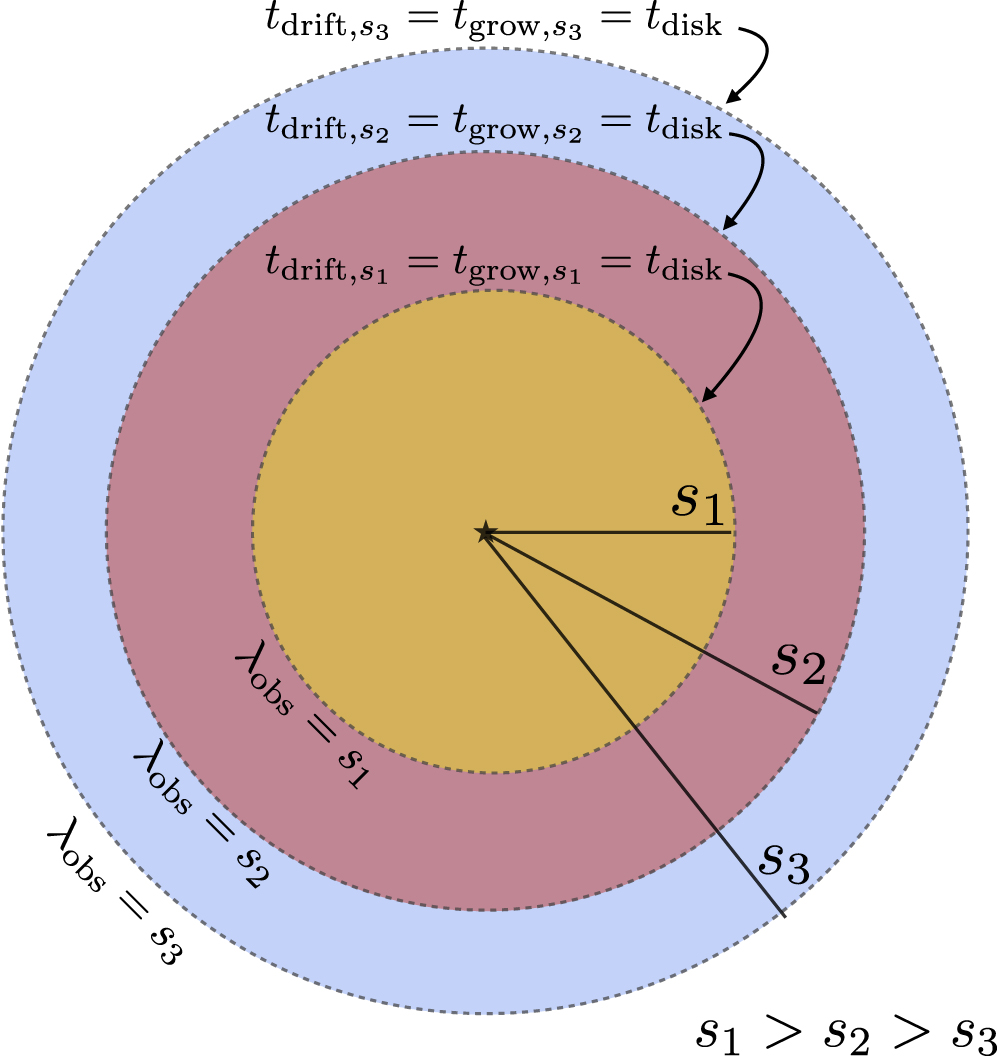
Schematic showing disk dust lines for three different particle sizes, s1 > s2 > s3. Particles of size s1 exist in the yellow region, so in observations at wavelength λobs = s1, a disk the size of the yellow region will be seen. Particles of size s2 exist in the yellow and red region, so a disk will extend to the end of the red region for λobs = s2. Particles of size s3 exist throughout the disk, so the full disk size will be seen for λobs = s3. [Powell et al. 2017]
How Does It Work?
Particles in a protoplanetary disk collide and stick together, thereby growing over time. But particles are also removed from the outskirts of the disk by a process called drift. More massive particles are removed from closer in to the star, so average particle sizes get smaller the further from the star you move out in a disk. For this reason, the disk’s radial size appears to be different in different wavelengths: at long wavelengths (i.e., looking at large particles) a disk might only span 50 AU, whereas at smaller wavelengths (looking at small particles) the same disk may span 300 AU. These different outer edges are known as dust lines.
The model proposed by Powell and collaborators relies on the idea that at a dust line for a given particle size, the growth timescale and drift timescale for particles of that size are both equal to the age of the disk. Setting these theoretical timescales equal at dust lines and using the age of the disk (expected to be the same as the age of the star, which is measurable) makes it possible to calculate the surface density profile for the disk. In this way, the profile can be measured without the need for assumptions about abundances or dust-to-gas ratios.
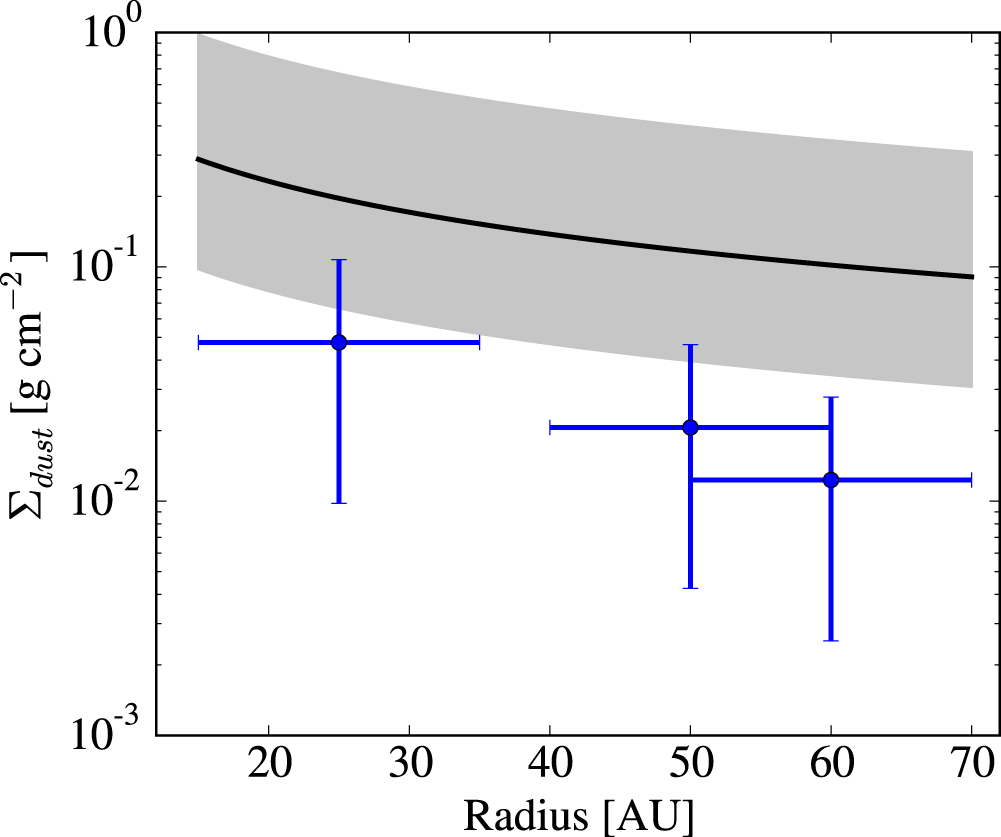
Dust surface density calculated by authors for TW Hya (blue points), compared to the dust surface density previously estimated for the system using an assumed dust-to-gas ratio (black line). The authors’ measurements are systematically lower. [Powell et al. 2017]
Testing the Approach
The team tested their technique on the disk TW Hya, finding a surface density profile that’s in agreement with lower limits set from measurements of the HD gas in the disk. Powell and collaborators then describe a series of observational tests of their technique that, when applied to a larger set of protoplanetary disks from future ALMA observations, will hopefully confirm the validity of their approach.
If this new method of measuring disk surface density profiles indeed proves successful, it could have an enormous impact on the field, making it much easier to learn about the evolution of protoplanetary disks and the planets forming within them.
Citation
Diana Powell et al 2017 ApJ 840 93. doi:10.3847/1538-4357/aa6d7c
1 Comment
Pingback:dust lines reveal planetary disk structure