Featured Image: Lensed Quasars and the Hubble Constant
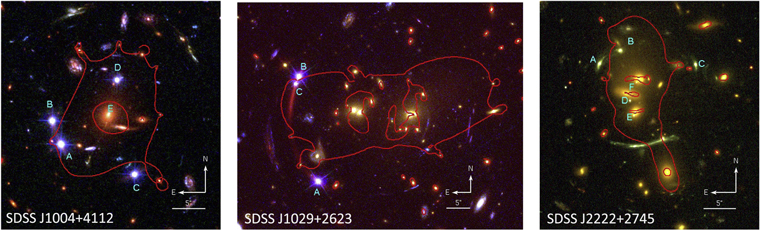
Hubble Space Telescope images of the three lensed quasars studied in this work. The multiple lensed images of the quasars are indicated by the cyan letters. [Napier et al. 2023]
Finding other ways to measure the Hubble constant may help alleviate the tension. In a recent article, Kate Napier (University of Michigan) and collaborators describe their derivation of the Hubble constant from observations of distant quasars: extremely luminous galactic centers in the early universe that are powered by matter falling onto a supermassive black hole. The quasars in the team’s sample are gravitationally lensed by clusters of galaxies, meaning that their light has been bent and magnified by the immense gravity of the clusters. The resulting value of the Hubble constant is consistent with measurements made from both the cosmic microwave background and supernovae, but the technique isn’t yet precise enough to favor one value over the other. To learn more about the use of lensed quasars for measuring the Hubble constant, be sure to check out the full article linked below.
Citation
“Hubble Constant Measurement from Three Large-Separation Quasars Strongly Lensed by Galaxy Clusters,” Kate Napier et al 2023 ApJ 959 134. doi:10.3847/1538-4357/ad045a