Images RSS

RX Puppis and its nova shells

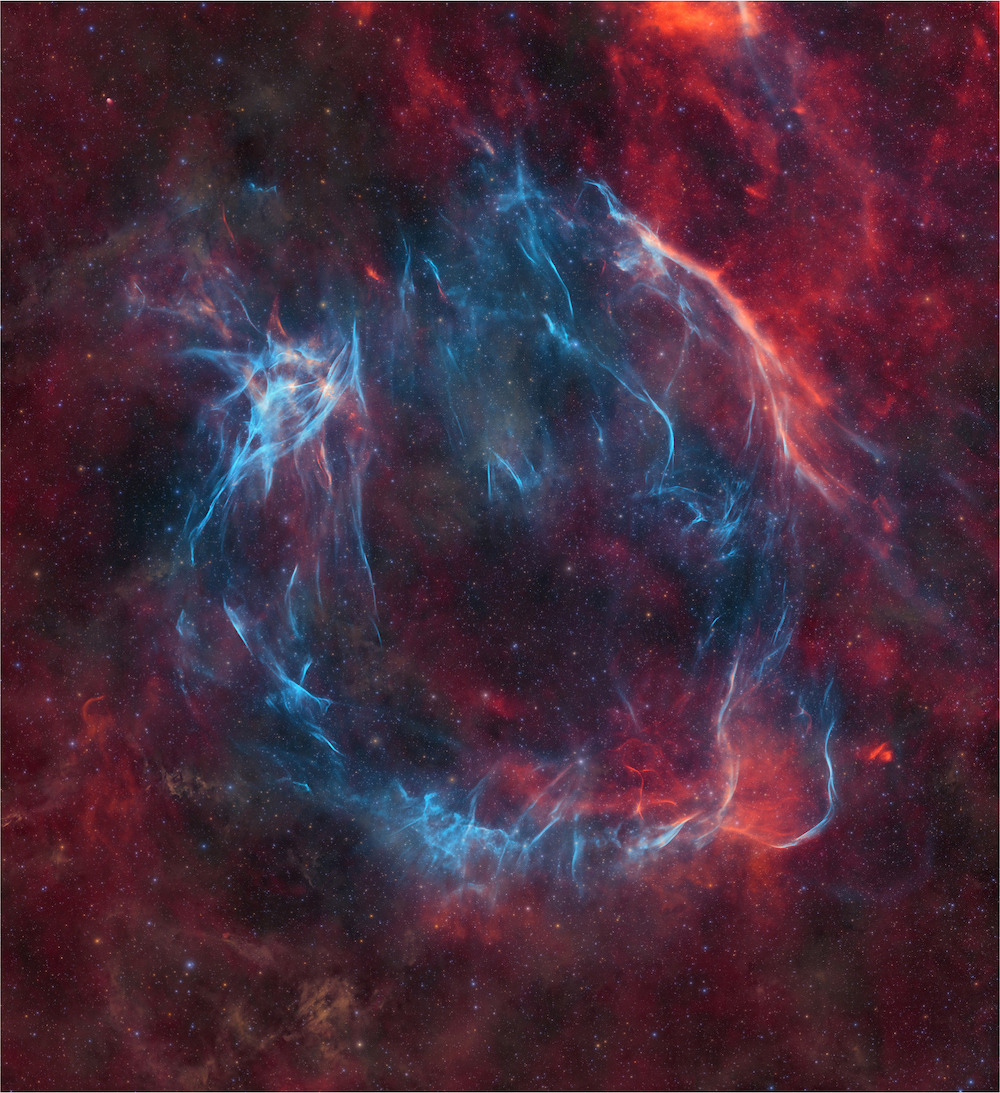
RX Puppis, marked with crosshairs in the image above, is a symbiotic star: a binary system containing a puffy red giant and a compact white dwarf or neutron star. As the compact object accretes matter from the red giant, the stolen gas can ignite in a flash of nuclear fusion, powering a nova outburst that brightens the system for anywhere from days to decades. In the 1970s, researchers observed a slowly evolving outburst from RX Puppis. But nova outbursts from symbiotic stars usually recur — is there any evidence of previous outbursts from this sytem? Using the 1-meter Swope telescope in Las Campanas, Chile, and the Southern African Large Telescope, Krystian Iłkiewicz (University of Warsaw, Durham University) and collaborators discovered an arc-like emission feature that appears to be the remnant of a shell of gas ejected during an outburst roughly 1,300 years ago. They also discovered a hint of a second shell that might be from an eruption 7,000 years ago. Given the locations of these two shells and the timing of the 1970s outburst, Iłkiewicz’s team concluded that the rate at which the white dwarf amasses gas from its companion has increased by a factor of three over the past 10,000 years. This is the first time a change in mass transfer rate has been measured in a binary system over such a long timescale. To learn more about this discovery, be sure to check out the full research article linked below.

Citation

“Ancient Nova Shells of RX Pup Indicate Evolution of Mass Transfer Rate,” Krystian Iłkiewicz et al 2024 ApJL 972 L14. doi:10.3847/2041-8213/ad6e5a

two images showing the results of cosmic web finding algorithms

Astronomers have found a slimy solution to a tricky problem. Simulations show that matter in our universe is arranged along strands of what’s called the cosmic web — an interconnected series of filaments surrounding bubble-like voids — but discerning the structure of this web is challenging; the filaments that connect luminous galaxies are constructed from dark matter and dim, diffuse gas. In a recent research article, Farhanul Hasan (New Mexico State University) and collaborators demonstrated a new way to reconstruct the cosmic web from the positions of galaxies. The team’s algorithm takes cues from Physarum polycephalum, a type of slime mold that forms intricate filamentary structures as it searches for food. Applying this method to galaxies from the IllustrisTNG cosmological simulation, Hasan’s team showed that the slime-mold-inspired method (right-hand panel above) outperforms the method previously used by the authors (left-hand panel). The blue pattern in the background of the images above shows the dark matter density, gray circles represent galaxies, and the red and yellow lines show cosmic web filaments traced by the algorithm. To learn more about how slime mold informs studies of the cosmic web, be sure to check out the full article linked below.

Citation

“Filaments of the Slime Mold Cosmic Web and How They Affect Galaxy Evolution,” Farhanul Hasan et al 2024 ApJ 970 177. doi:10.3847/1538-4357/ad4ee2

visualization of the position and velocity structure of stars in the Milky Way

Ready to be mesmerized by an elegant data visualization? You can now watch the endless, swirling trajectories of 170 million stars in our galaxy using a simple interactive tool. A team led by Joshua Speagle (沈佳士) from the University of Toronto used data from five surveys — the Panoramic Survey Telescope and Rapid Response System (Pan-STARRS), the Two Micron All Sky Survey (2MASS), the United Kingdom Infrared Telescope Infrared Deep Sky Survey (UKIDSS), the “unofficial” Wide-field Infrared Survey Explorer (unWISE), and the Gaia survey — to craft this visualization. In the image above, the color scale shows the tangential speed of stars within a certain distance bin, while the white streamlines show the stars’ tangential velocity. You can play around with the full visualization, which allows you to filter by distance and switch the color overlay between velocity, density, metallicity, and age. To learn more about the data selection process and the construction of the final star catalog, be sure to check out the full research article linked below.

Citation

“Mapping the Milky Way in 5D with 170 Million Stars,” Joshua S. Speagle et al 2024 ApJ 970 121. doi:10.3847/1538-4357/ad2b62

In stellar nurseries throughout the Milky Way, baby stars swaddled in dusty blankets are growing rapidly and shaping their birth environments. Recently, a research team led by Samuel Federman (University of Toledo) used JWST to investigate the behavior of five young protostars, two of which are shown in the image above. The new JWST images capture the squalls of protostars in their earliest stages, about which relatively little is known. During these early stages, protostars are swathed in dense, dusty envelopes of gas that fall onto the star, spurring rapid growth through accretion. The accretion, in turn, powers narrow outflowing jets and wide outflowing winds that carve out a cavity in the surrounding envelope, creating the characteristic hourglass shapes in the images above. For more information and a closer look at all of the protostars in the sample, be sure to check out the full research article linked below.

Citation

“Investigating Protostellar Accretion-driven Outflows across the Mass Spectrum: JWST NIRSpec Integral Field Unit 3–5 μm Spectral Mapping of Five Young Protostars,” Samuel A. Federman et al 2024 ApJ 966 41. doi:10.3847/1538-4357/ad2fa0

Nereides supernova remnant

Full view of the Nereides supernova remnant

Full view of the newly discovered Nereides supernova remnant G107.7-5.1. [Fesen et al. 2024]

The images above and to the right show the delicate gaseous filaments of a newly discovered supernova remnant, the Nereides Nebula. Over the past two years, a team led by Robert Fesen (Dartmouth College) has studied supernova remnants from 10 observing sites across Europe, Africa, New Zealand, and the US. Through the course of this campaign, the team racked up more than 1,000 hours of exposure time and produced more than 12,000 images, greatly improving the quality of data available for nine known Milky Way supernova remnants — and they discovered three more supernova remnants along the way. The new images demonstrate the immense size and intricate tracery of these exploded stars, and in some cases, reveal never-before-seen emission structures. It was a challenge to pick just a single image to appear in today’s post — be sure to check out the article linked below to see all of the new images!

Citation

“Deep Optical Emission-Line Images of Nine Known and Three New Galactic Supernova Remnants,” Robert A. Fesen et al 2024 ApJS 272 36. doi:10.3847/1538-4365/ad410a

Cassiopeia A supernova remnant as seen by JWST

Cassiopeia A is a much-photographed supernova remnant in the northern celestial hemisphere, and now, thanks to JWST, it has a stunning new portrait. Using data from JWST’s Near-Infrared Camera and Mid-Infrared Instrument, Jeonghee Rho (SETI Institute and Seoul National University) and collaborators crafted the three-color image shown above. The diffuse blue areas show the light emitted by electrons spiraling around magnetic field lines, while the more finely detailed red and green areas trace light from argon and carbon monoxide, respectively. Coupled with spectra of two dense knots of gas within the shell of the supernova remnant, these observations allowed Rho’s team to study the connections between the formation of molecules like carbon monoxide and the creation of cosmic dust. For more new images of Cassiopeia A, including some incredible closeups of filamentary gas, be sure to check out the full research article linked below!

Citation

“Shockingly Bright Warm Carbon Monoxide Molecular Features in the Supernova Remnant Cassiopeia A Revealed by JWST,” J. Rho et al 2024 ApJL 969 L9. doi:10.3847/2041-8213/ad5186

What at first appears to be a glowing strand of molten iron in the image above is something far wilder: a distant galaxy whose light has been stretched into galactic taffy by the immense gravity of an intervening galaxy cluster. This phenomenon, known as strong gravitational lensing, multiplies and magnifies images of faraway sources, allowing astronomers to use massive objects like galaxy clusters as natural telescopes. Look closely at the zoomed-in version of the image: three points of light stand out against the glow of the lensed galaxy. These three dots are multiple images of a single supernova cataloged as SN H0pe. Researchers plan to use this rare multiply imaged supernova to calculate the Hubble constant, which quantifies the universe’s expansion rate. Using observations from JWST, a team led by Justin Pierel (Space Telescope Science Institute) calculated the time delay of the light from the images, finding arrival times offset by 49 and 117 days. The value of the Hubble constant derived from these observations will be reported in a future publication. In the meantime, be sure to check out the details of these initial calculations in the article linked below.

Citation

“JWST Photometric Time-Delay and Magnification Measurements for the Triply Imaged Type Ia “SN H0pe” at z = 1.78,” J. D. R. Pierel et al 2024 ApJ 967 50. doi:10.3847/1538-4357/ad3c43

starburst galaxy Messier 82

Starburst galaxies are prolific star factories, churning out tens to hundreds of stars each year. By contrast, the Milky Way crafts just a handful of stars annually. Recently, a team led by Alberto Bolatto (University of Maryland) turned JWST toward the cigar-shaped galaxy Messier 82, which is a starburst galaxy 12 million light-years away. Messier 82’s star formation rate has cooled from an impressive peak of 160 solar masses of stars per year 8–15 million years ago to 12 solar masses per year today. The team sought to study the powerful winds that whisk away star-forming gas from the galaxy’s center. In the image above, which shows the central few thousand light-years of the galaxy, red represents 3.3-micron (1 micron = 10-6 meter) emission that largely comes from polycyclic aromatic hydrocarbons: sooty molecules that contain multiple rings of carbon atoms bonded together. (Green and blue represent 2.5-micron and 1.6-micron emission, respectively; the compact green areas are mostly supernova remnants.) These new observations show in great detail the narrow, intertwined filaments and bubbles highlighted by the 3.3-micron emission. The filaments may have formed when dense, dusty clumps of gas were shredded by the outflowing galactic wind. To dive into the science behind this image, be sure to check out the full research article linked below.

Citation

“JWST Observations of Starbursts: Polycyclic Aromatic Hydrocarbon Emission at the Base of the M82 Galactic Wind,” Alberto D. Bolatto et al 2024 ApJ 967 63. doi:10.3847/1538-4357/ad33c8

snapshot of a simulation of gas outflows from the plane of a galaxy

When massive stars go supernova, their deaths can reshape their home galaxies. Using a high-resolution fluid dynamics simulation, Evan Schneider and Alwin Mao (University of Pittsburgh) examined how supernova explosions affect the distribution and temperature of a galaxy’s star-forming gas. Their simulations tackled how a galaxy similar to the cigar-shaped starburst galaxy Messier 82 evolves under the influence of supernovae. Synthetic star clusters scattered throughout the modeled galactic disk gradually warm their surroundings as they rotate in the plane of the galaxy, then suddenly inject large amounts of heat and energy when the stars explode. The image above shows a snapshot of the simulation after 30 million years of evolution, with red areas showing denser gas and blue areas showing more tenuous gas. Disrupted by stellar explosions, some of the disk’s gas flows into circumgalactic space, and Schneider and Mao found that the simulated outflow rate matches what has been estimated for nearby starburst galaxies. To learn more about this starburst galaxy simulation, be sure to check out the research article linked below.

Citation

“CGOLS V: Disk-Wide Stellar Feedback and Observational Implications of the Cholla Galactic Wind Model,” Evan E. Schneider and S. Alwin Mao 2024 ApJ 966 37. doi:10.3847/1538-4357/ad2e8a

Hubble Space Telescope images of three compact blue dwarf galaxies

The images above show three blue compact dwarf galaxies dotted with pink star-forming knots. Just a tenth of the size of the Milky Way, blue compact dwarfs are unique among galaxies with high star-formation rates in that they’re mostly free of dust and have low abundances of metals (elements heavier than helium) — properties they share with galaxies in the early universe. Using Hubble Space Telescope data, Rupali Chandar (University of Toledo) and collaborators investigated the star-formation histories of the three blue compact dwarfs pictured above. The team sought to understand whether these galaxies are all undergoing bursts of star formation, in which new stars are created at 10 times the usual rate. Their analysis revealed that while all three galaxies are forming plenty of new stars, only Haro 11 is truly experiencing a burst; ESO 185 was forming stars about four times faster than normal about 40 million years ago, and ESO 338 hasn’t seen much change in its star formation over the last few billion years. To learn more about the star-formation histories of these peculiar blue galaxies, be sure to check out the full research article linked below.

Citation

“A Tale of Three Dwarfs: Cluster-Based Star Formation Histories of Blue Compact Dwarf Galaxies,” Rupali Chandar et al 2024 ApJ 965 95. doi:10.3847/1538-4357/ad293a

1 2 3 4 5 23