
Editor’s Note: Astrobites is a graduate-student-run organization that digests astrophysical literature for undergraduate students. As part of the partnership between the AAS and astrobites, we occasionally repost astrobites content here at AAS Nova. We hope you enjoy this post from astrobites; the original can be viewed at astrobites.org.
Title: Geometry, Not Calorimetry, Drives the Radio–Infrared–γ Ray Correlation
Authors: T. A. Porter, I. V. Moskalenko, and G. Jóhannesson
First Author’s Institution: Stanford University
Status: Published in ApJ
Galaxies emit light not only in the visible band, but also across other wavelengths via different physical mechanisms. Finding correlations between emissions at different wavelengths is a powerful tool for astrophysicists to explore the underlying mechanisms of galaxy formation. One of the most famous examples is the infrared–radio continuum correlation, which holds across several orders of magnitude in luminosity.
The typical explanation for this correlation is that both infrared light and radio synchrotron emission share the same energetic origin: star formation. Young stars emit ultraviolet radiation, which is absorbed by interstellar dust and re-radiated in the infrared. When these stars end their lives in core-collapse supernovae, the resulting shock waves accelerate cosmic-ray electrons, which then interact with the magnetic field to produce synchrotron emission.
For this correlation to hold, cosmic-ray electrons must radiate away all their energy within the galaxy, unable to escape and carry away some of their energy. Otherwise, the amount of radio emission would depend on how quickly cosmic rays escape and would no longer correlate with the infrared emission. This assumption is called the “electron calorimeter” model, which assumes that electrons lose all their energy due to radiation without escaping the galaxy. However, observations show that the infrared–radio correlation persists even in low-density galaxies where cosmic rays can easily escape, suggesting that the calorimeter model may not be the full story. To reconcile this, previous studies proposed “conspiracy-like” scenarios in which cosmic-ray injection, transport, magnetic-field amplification, and gas density are all coupled in a finely self-regulating way to maintain the correlation across diverse galactic environments — a somewhat awkward explanation that requires multiple unrelated physical processes to conveniently work together.
With the increased sensitivity of the Fermi Large Area Telescope, high-energy gamma-ray (or γ-ray) detections add new information to this picture. A galaxy’s γ-ray emission is produced by two different sources: cosmic-ray protons interacting with the interstellar medium gas, and cosmic-ray electrons inverse-Compton scattering off of nearby starlight or photons from the cosmic microwave background. Since both processes involve cosmic rays, the total γ-ray emission should also reflect the amount of star formation and therefore correlate with infrared and radio emission.
Because all three wavelengths trace different pieces of the same cosmic-ray population, studying them together reveals how the galaxy’s total cosmic-ray energy budget is distributed across its multi-wavelength emission.
The infrared–radio correlation has been established not only at the scale of entire galaxies, but also locally, down to patches roughly 100 parsecs across. Think of it like the relationship between a city’s electricity consumption and its population: we have long known they track each other city-wide, but it turns out the same relationship holds block by block. The infrared–radio correlation works the same way: zoom into any 100-pc region within a galaxy, and the correlation is still there. Unfortunately, the resolution of γ-ray observations is still stuck at around the kiloparsec scale. It is therefore unclear whether the local infrared–radio correlation reflects a genuine local physical coupling, one that would extend to γ-rays if we had sufficient resolution, or whether it is simply a spatial average of the emission, smoothed out by insufficient resolution. The answer determines whether radio and γ-ray emission can be used as reliable tracers of star formation, or whether they are just smeared out by cosmic-ray propagation over kiloparsec scales.
In this study, the authors numerically model galactic cosmic-ray transport, building a suite of physically motivated three-dimensional models of the Milky Way. They consider two variants for each of the four key inputs: 1) the cosmic-ray source distribution, 2) the interstellar gas, 3) the amount of starlight within the galaxy (the interstellar radiation field), and 4) the galactic magnetic field. Crucially, every model is normalized to reproduce the locally observed cosmic-ray data to within 5%, so that any differences in the predicted emission come purely from the large-scale geometry of each input, rather than from variations in the total cosmic-ray budget.
After evolving cosmic-ray transport for these realistic models, the authors then compute synthetic observations at radio, infrared, and γ-ray bands from various viewing inclinations to investigate how the underlying galactic model and the viewing angle affect the correlations between these emissions.
Surprisingly, inclination plays the most important role — more so than the cosmic-ray source distribution, the radiation field, or the magnetic field. Figure 1 shows the correlation plots between the radio and γ-ray emission (left two columns) and between infrared and γ-ray emission (right two columns) when viewing the galaxy face-on (i.e., viewing the galaxy from directly above the disk). Different colors represent γ-ray emission components from different physical mechanisms, with orange showing the total γ-ray emission. For both sets of correlation plots, starting from the upper-left panel, each panel modifies one physical input and recomputes the emission. Although there is some variation, one can see that the γ-ray emission correlates with both the radio and the infrared emission over several orders of magnitude, regardless of the underlying input model.
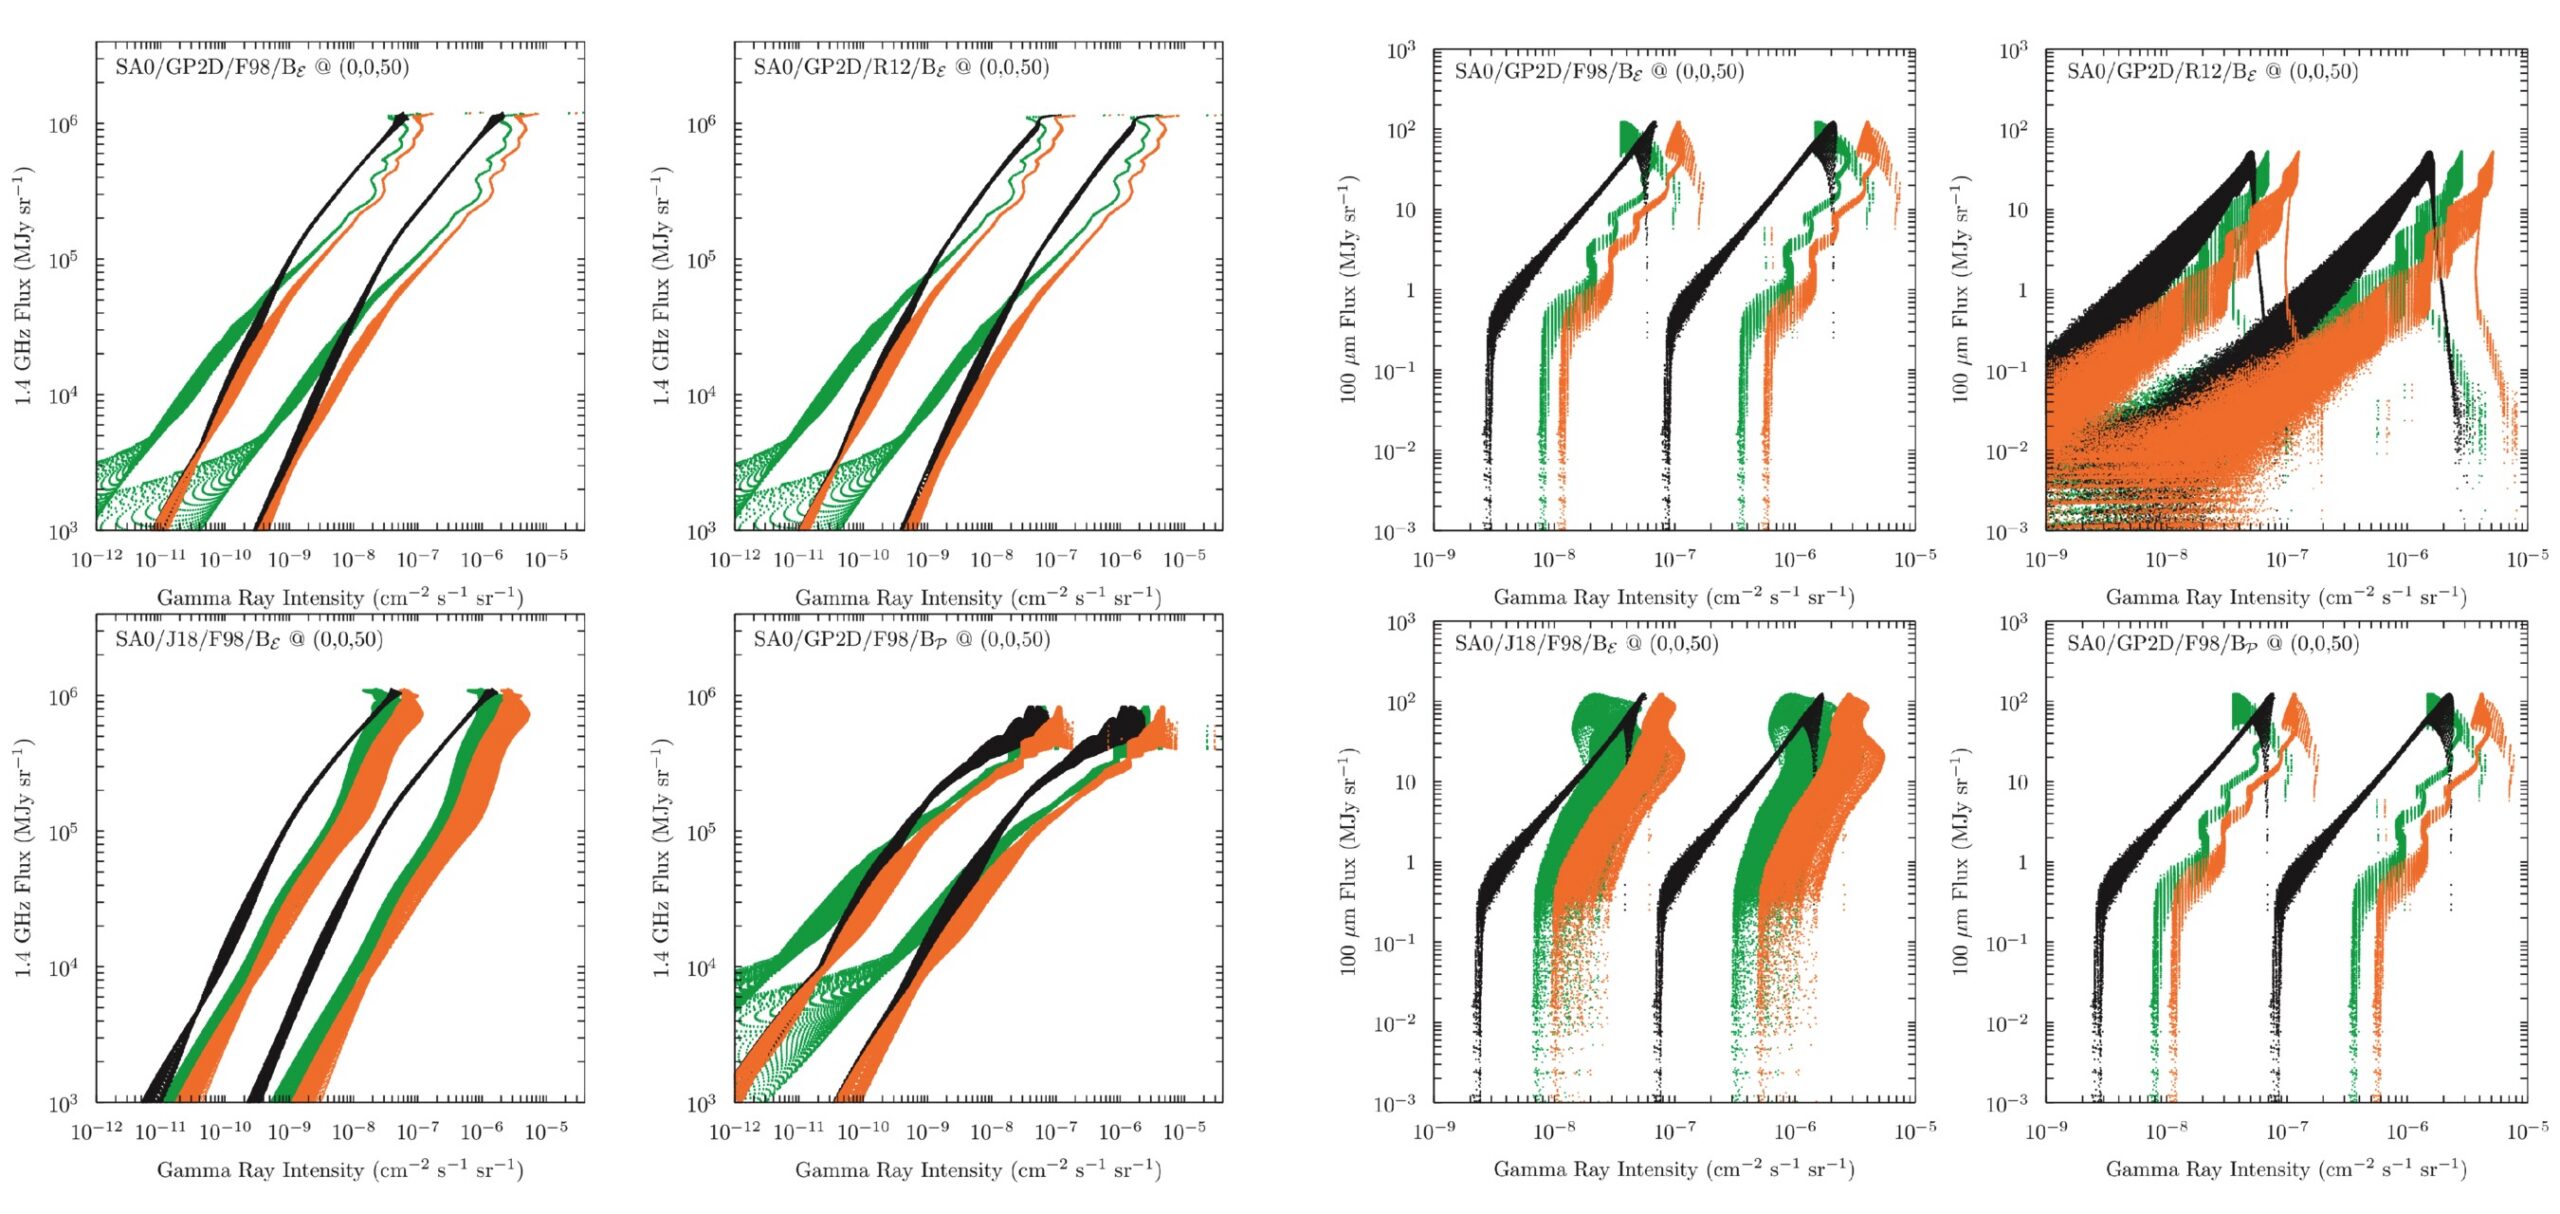
Figure 1: Radio (left two columns) and infrared (right two columns) vs. γ-ray correlation plots for a galaxy viewed face-on from 50 kpc. Each panel modifies one input — the cosmic-ray source distribution, gas, radiation field within the galaxy, or magnetic field — relative to a baseline model. Colors indicate γ-ray production mechanisms (green: proton–gas; black: inverse-Compton; orange: total). Across all variations, both the radio–γ-ray and infrared–γ-ray correlations remain quasi-linear over several orders of magnitude, showing that the correlations are robust to the choice of underlying galactic model. [Adapted from Porter et al. 2026]
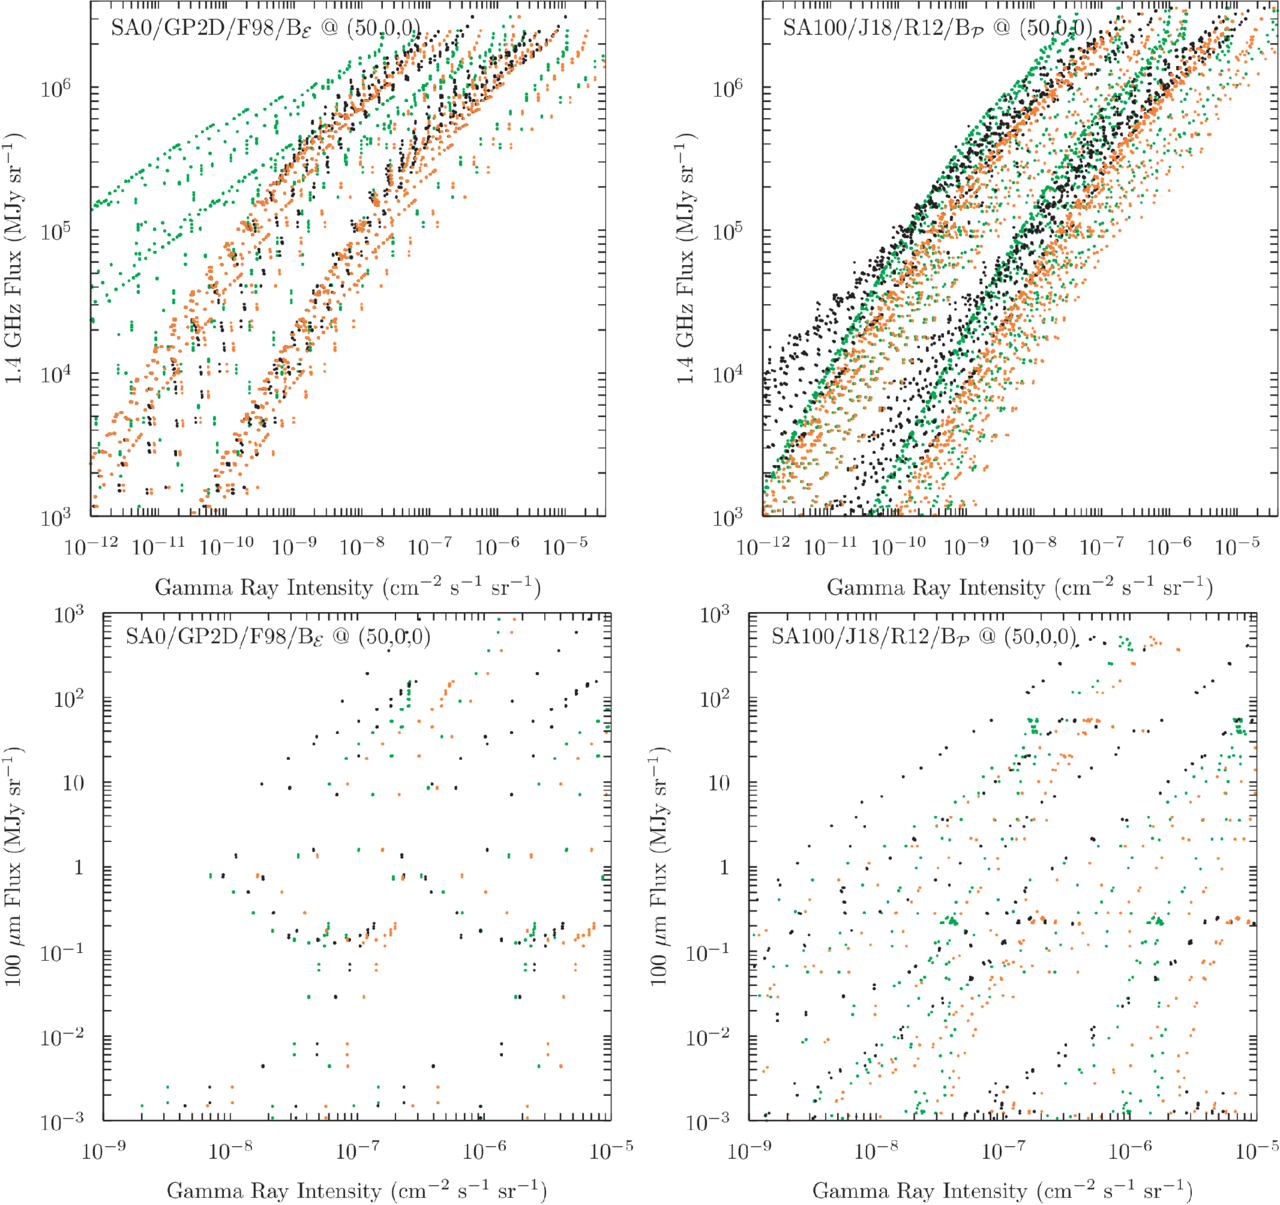
Figure 2: Correlation plots for two galaxy models viewed edge-on from 50 kpc — simple axisymmetric (left) and complex with spiral arms (right). Top: radio vs. γ-ray; bottom: infrared vs. γ-ray. Colors indicate γ-ray production mechanisms (green: proton–gas; black: inverse-Compton; orange: total). The infrared–γ-ray correlation breaks down, while the radio–γ-ray correlation is broadened but partially preserved. [Porter et al. 2026]
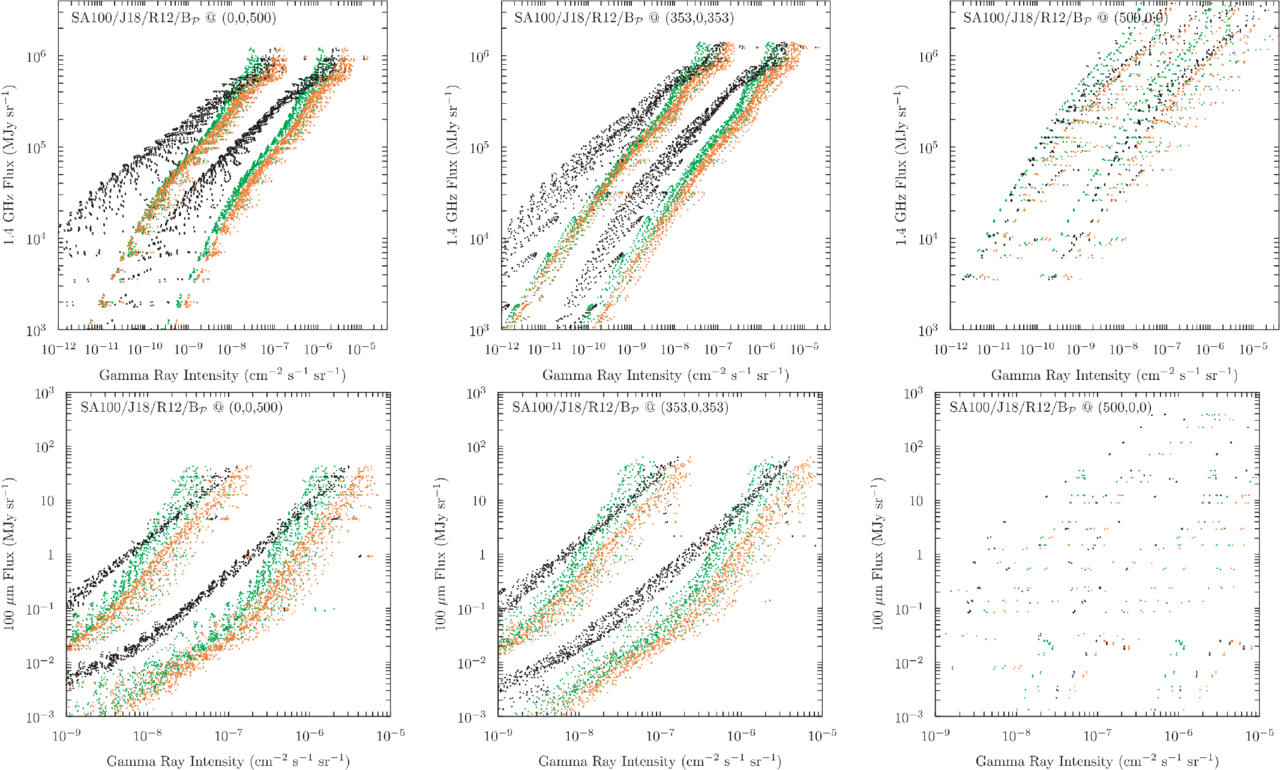
Figure 3: Correlation plots from a complex galaxy model viewed from 500 kpc, at three different inclinations (face-on, 45°, edge-on). Top row: radio vs. γ-ray; bottom row: infrared vs. γ-ray. Colors indicate different γ-ray production mechanisms (green: proton–gas; black: inverse-Compton; orange: total). At this distance, the blurring effect of large pixels restores a tight correlation even in the edge-on view. [Porter et al. 2026]
Original astrobite edited by Kelsie Taylor.
About the author, Sandy Chiu:
I’m a PhD candidate at the University of Michigan, Ann Arbor. I’m interested in numerical simulations of cosmic rays feedback in galaxies and their comparison with observation.