
Editor’s Note: Astrobites is a graduate-student-run organization that digests astrophysical literature for undergraduate students. As part of the partnership between the AAS and astrobites, we occasionally repost astrobites content here at AAS Nova. We hope you enjoy this post from astrobites; the original can be viewed at astrobites.org.
Title: Phase-Dependent Magnetic Coherence in the Turbulent Interstellar Medium
Authors: Iryna S. Butsky et al.
First Author’s Institution: Stanford University
Status: Accepted to ApJ
The space between stars isn’t empty, because it’s threaded with magnetic fields that shape how gas moves and steer cosmic rays as they race across the galaxy. As a result, understanding how the magnetic field is structured within different components of the interstellar medium, specifically clouds of different temperatures, is a key part of understanding how the interstellar medium we see today takes shape.
Because magnetic fields are invisible, astronomers need tracers to reveal their structure. One such tracer is the emission from dust grains. Dust grains are not spherical, and a dust grain’s long axis tends to align at a right angle to the magnetic field, causing dust grains to emit light that vibrates in a particular direction. This is called polarized emission. If the magnetic field in a region is very ordered, the grains all align the same way, and a large fraction of their emitted light vibrates in the same direction, giving a high polarization fraction. This fraction is therefore used as a proxy for whether the field can maintain a consistent direction on large scales (an ordered/regular magnetic field).
Comparing the polarization fraction with other tracers of gas lets astronomers infer the field’s structure in the interstellar medium. Previous observations found that the polarization fraction correlates with the fraction of cold gas, but not with the total amount of gas along the line of sight. This suggests that the field is preferentially ordered within cold clouds rather than warm clouds. Curiously, this seemed to contradict other studies that found the field to be more ordered in the warm clouds. Such disagreements are where simulations become useful: because the true magnetic field is known in a simulation, astronomers can test which interpretation the observations actually support.
In this article, the authors use high-resolution numerical simulations to reproduce the relationship between polarization fraction and cold cloud fraction. They find that as long as the line of sight crosses fewer than about 20 clouds, the polarization fraction correlates with the cold cloud fraction, but not with the total neutral gas (Figure 1). This matches earlier observations, where the correlation shows up at high galactic latitudes, which point out of the galactic plane and therefore cross only a few cold structures. When too many clouds lie along the line of sight, each cloud carries an ordered field pointing in a different direction. Averaged together, these vibration directions cancel out, lowering the polarization fraction and washing the correlation away.
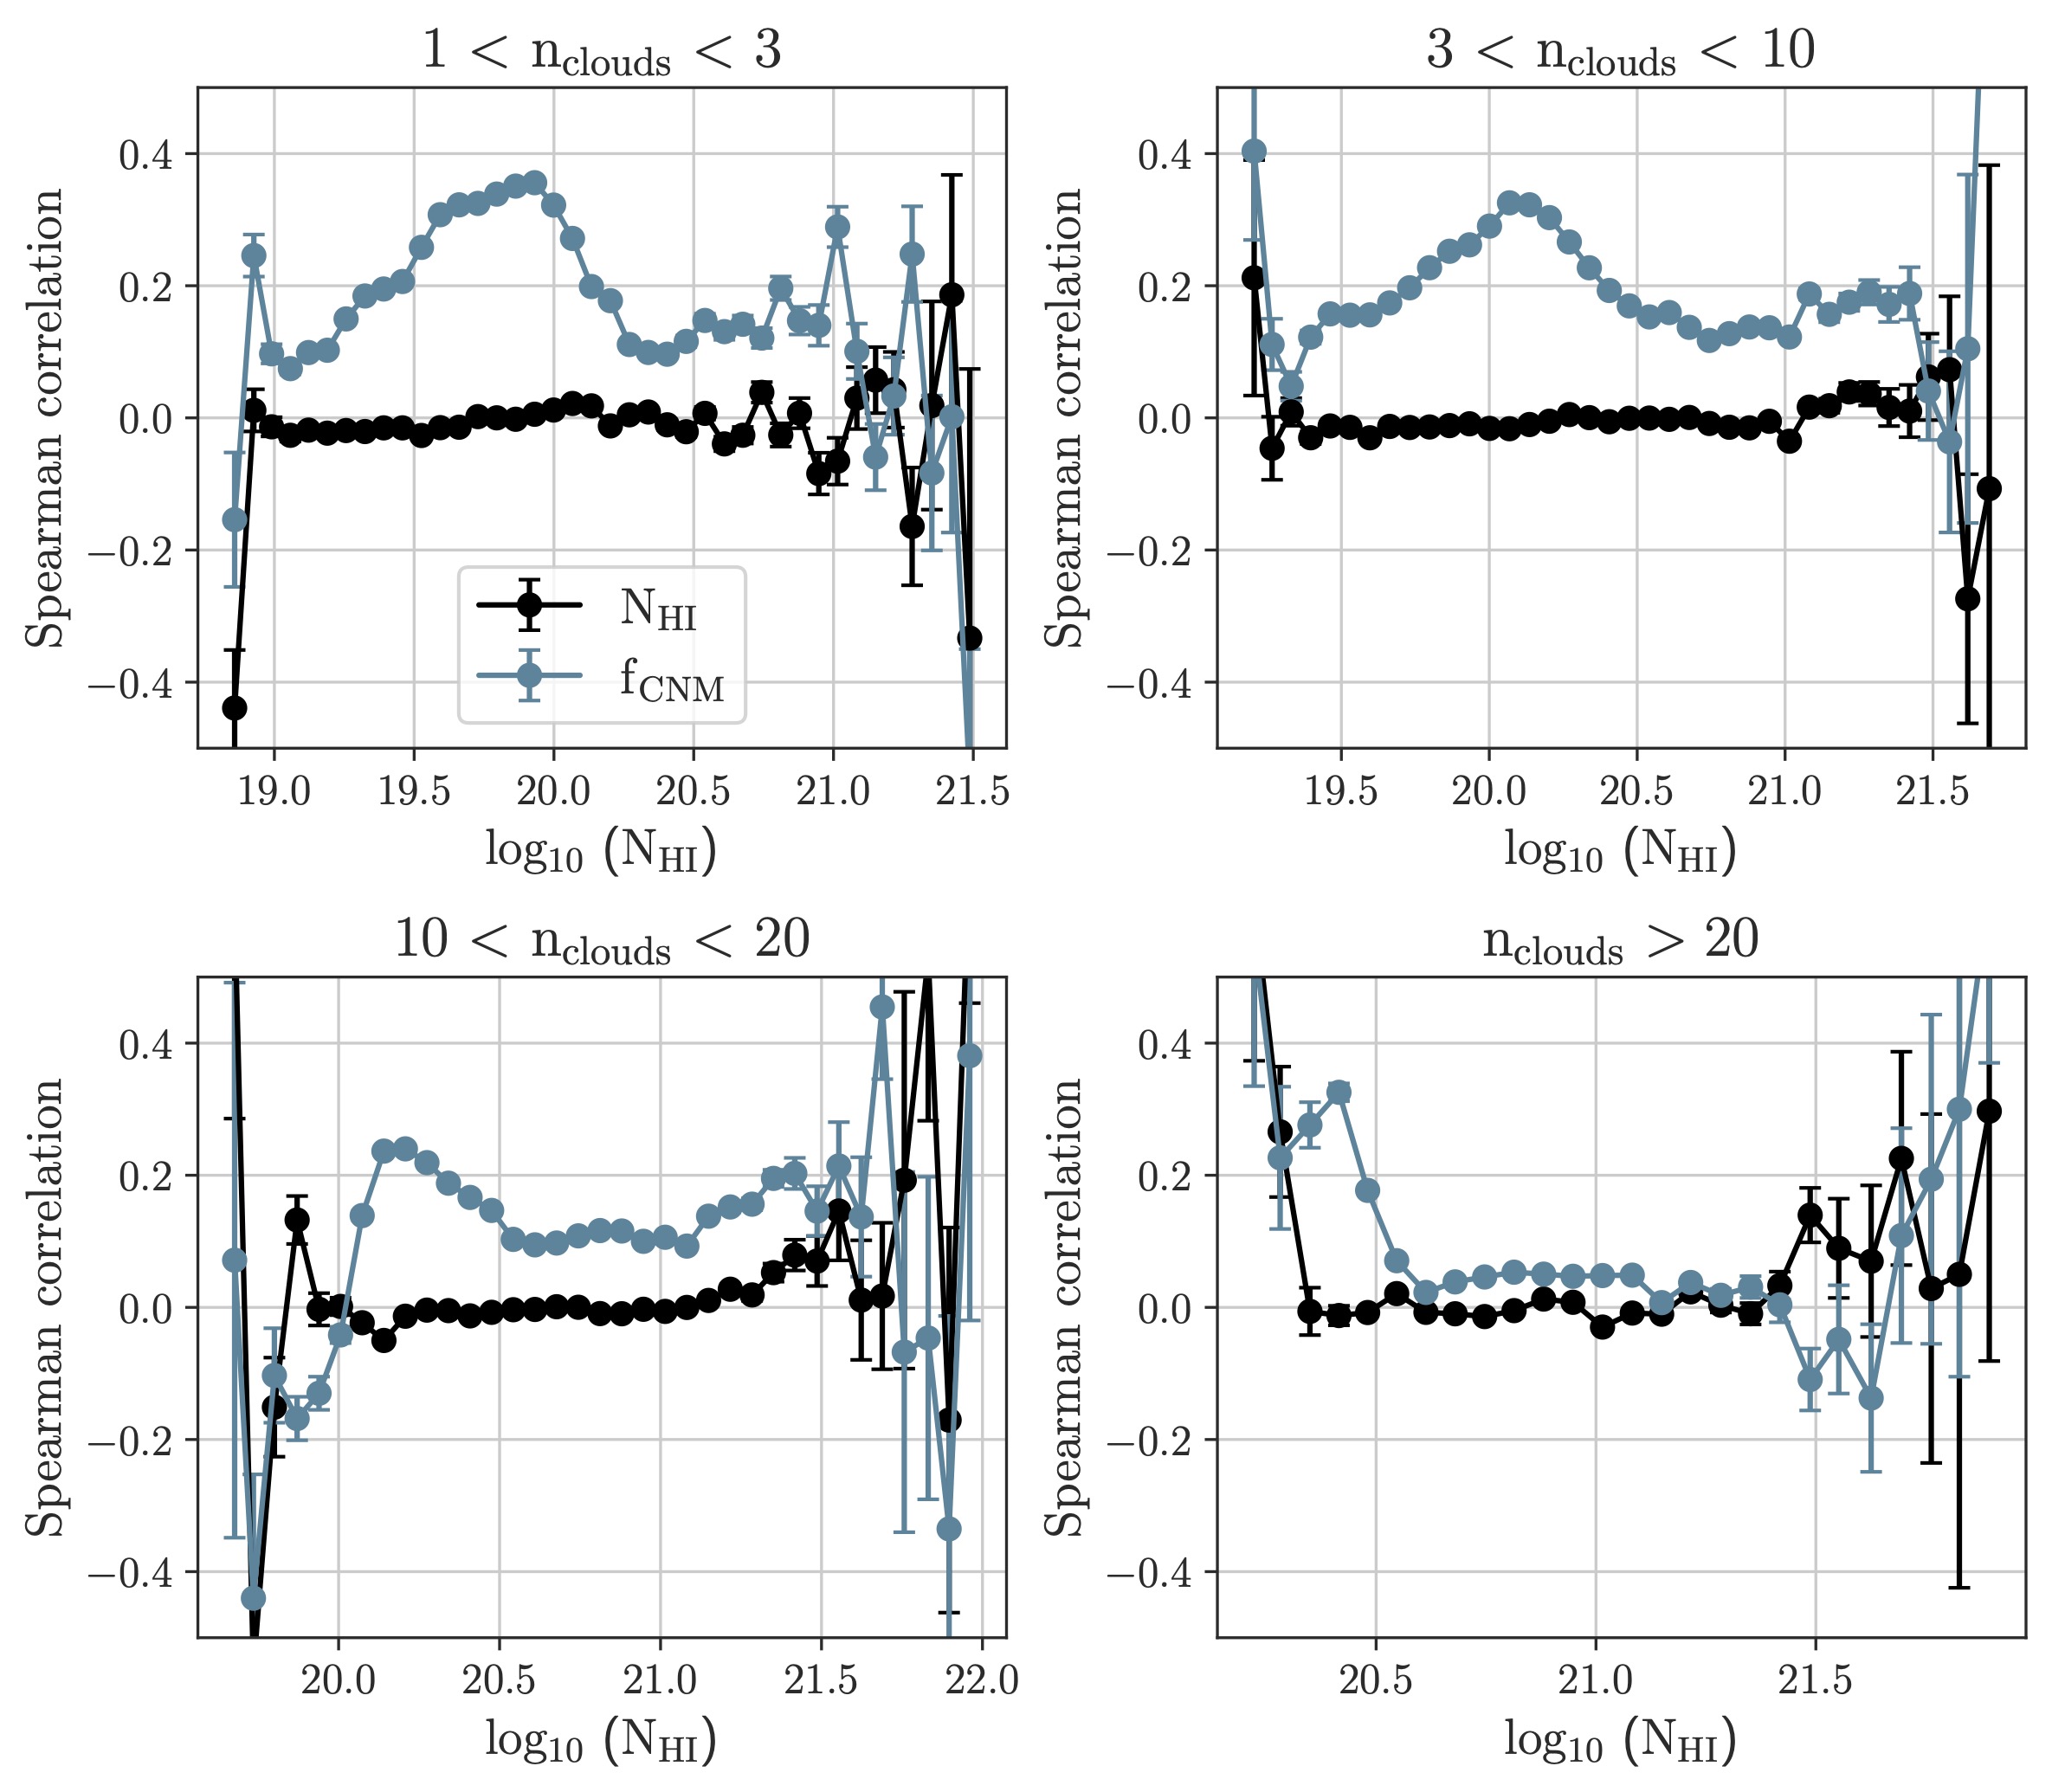
Figure 1: Correlation between dust polarization fraction, the total gas amount (neutral hydrogen column density, NHI), and the fraction of cold medium along the line of sight (fCNM) for projections of different path lengths. The polarization fraction correlates with fCNM but not with NHI. The correlation disappears once many clouds lie along the line of sight (see lower-right panel). [Butsky et al., in press]
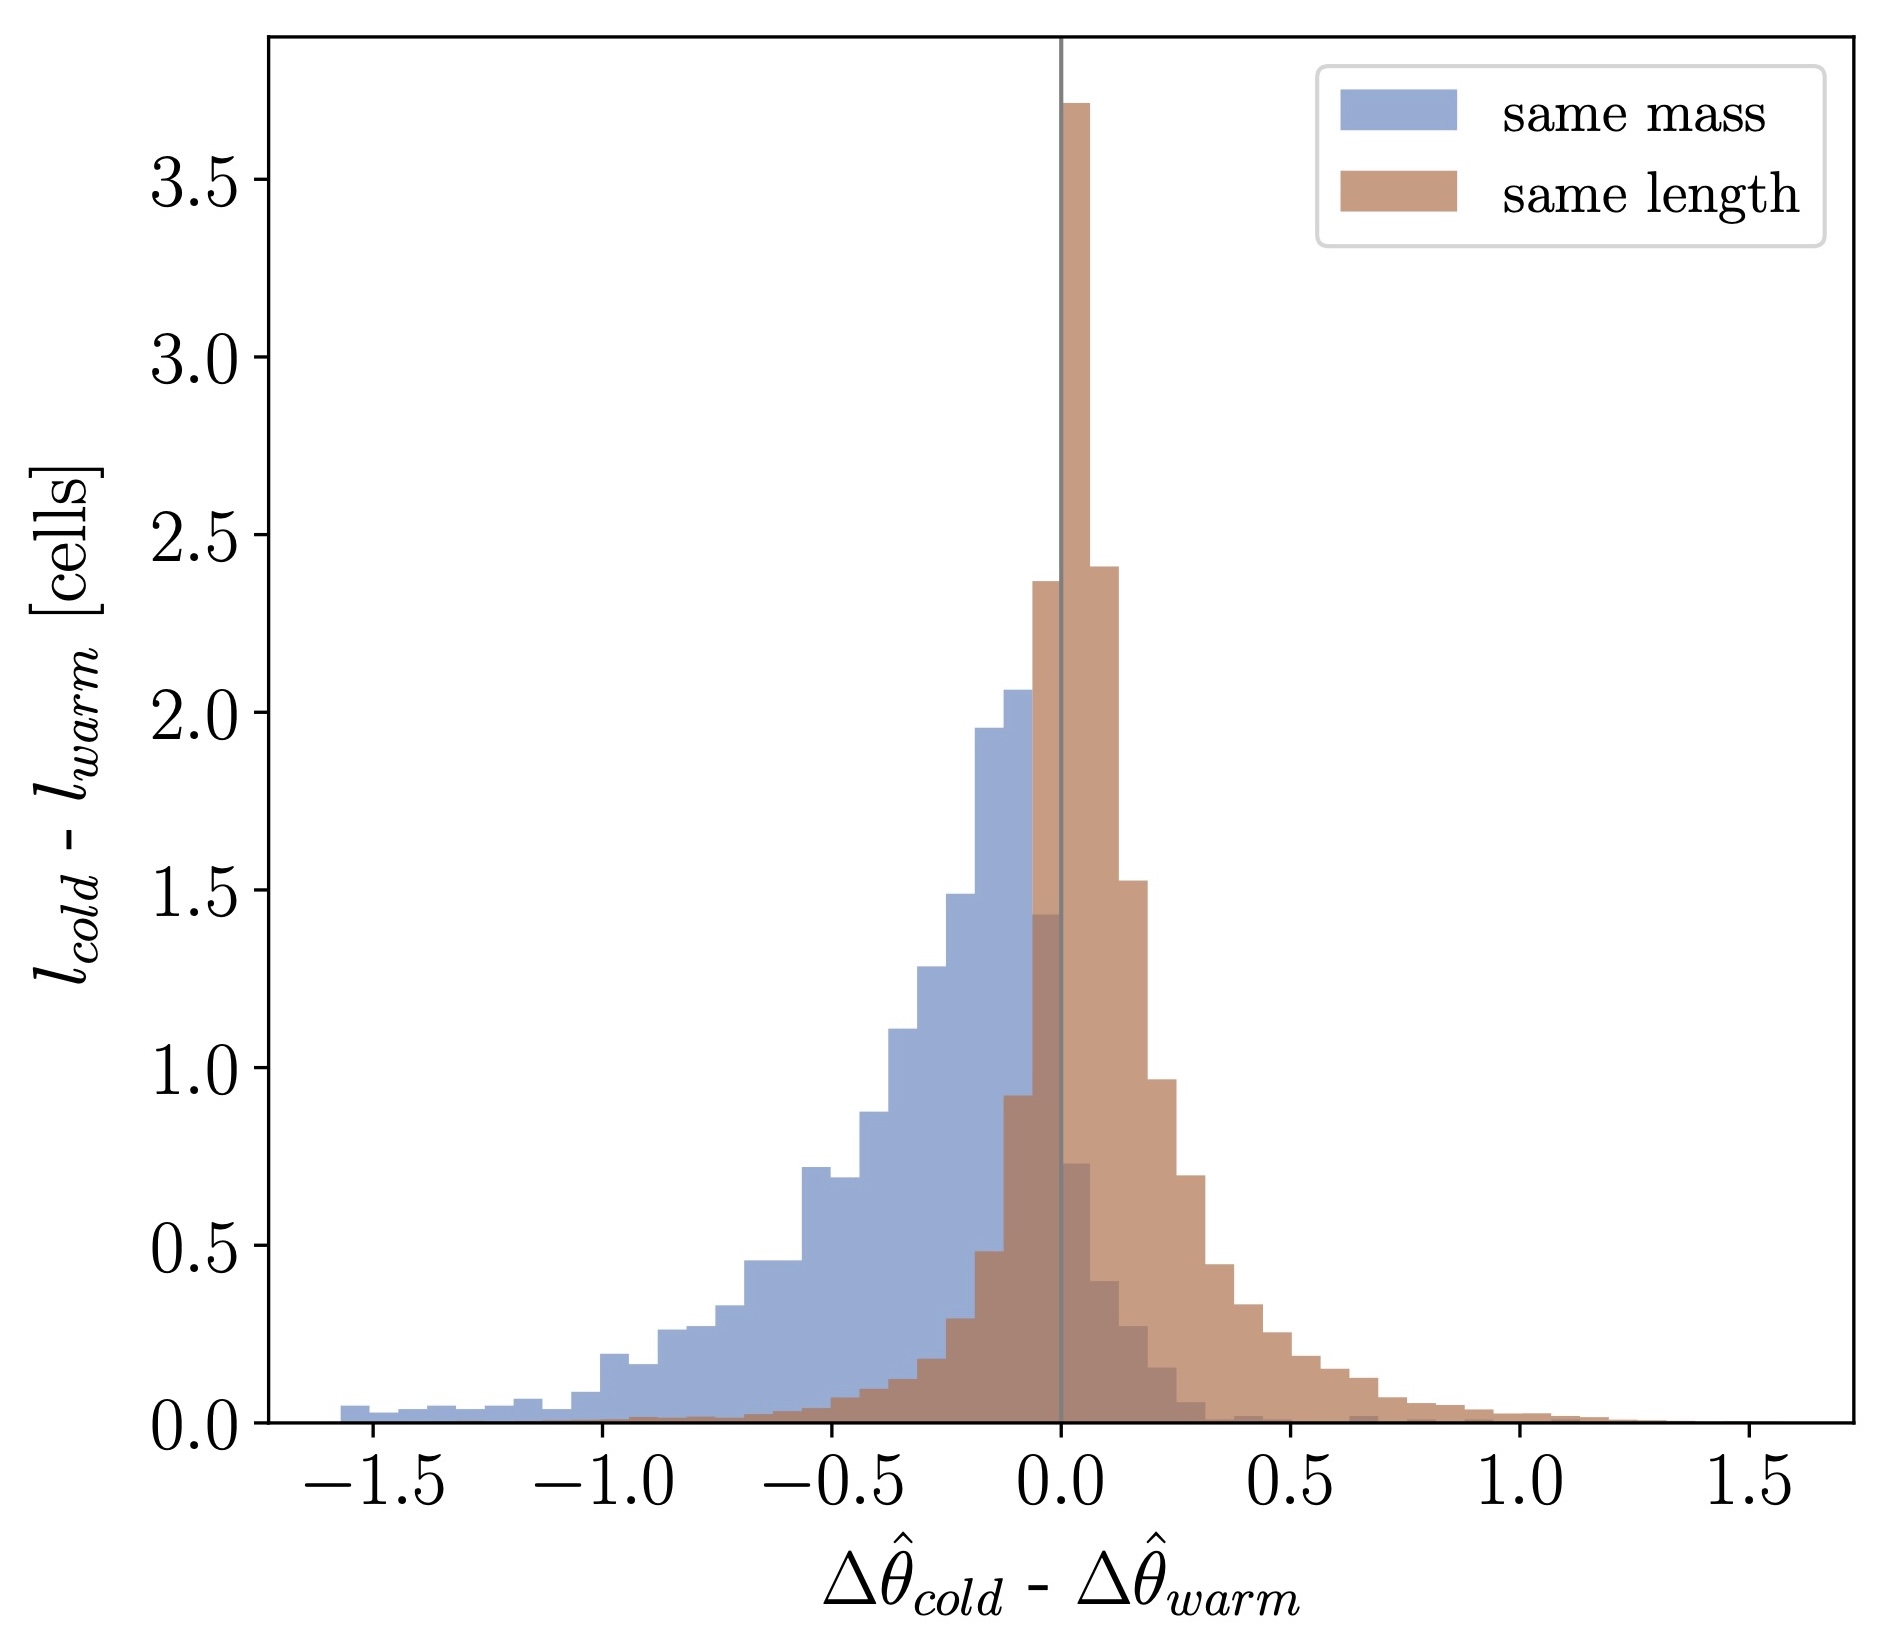
Figure 2: Distribution of the angle difference between the average magnetic field and the line of sight for cold and warm clouds, shown for clouds matched by mass and by length. A smaller angle difference means a more ordered field. At similar mass, cold clouds show a more ordered field; at similar length, the reverse holds. [Adapted from Butsky et al., in press]
This apparent paradox comes from the different nature of cold and warm clouds. Cold clouds are denser and more compact, occupying much smaller physical scales than warm clouds. So to match the length of a warm cloud, you have to string together several cold structures, sampling more of the field’s variation and making the cold gas look disordered. Measured per unit length, then, warm clouds appear more ordered. Measured per unit mass, cold clouds appear more ordered. Crucially, when we observe dust emission, we are naturally weighting by mass, so real observations effectively trace the polarization fraction per unit mass, the regime in which the cold clouds are the more coherent phase.
In the end, this work shows that the ordering of interstellar magnetic fields depends on both the gas phase and how we choose to measure it. Cold clouds carry more coherent fields per unit mass, which is exactly the quantity dust observations trace, resolving an apparent contradiction between earlier studies. It is a reminder that even our best observations come with hidden assumptions, and that simulations, where the true field is known, are essential for interpreting what the sky is really telling us.
Original astrobite edited by Viviana Cáceres.
About the author, Sandy Chiu:
I’m a PhD candidate at the University of Michigan, Ann Arbor. I’m interested in numerical simulations of cosmic rays feedback in galaxies and their comparison with observation.