
Researchers investigated the properties of M-dwarf stars within a gap discovered using Gaia spacecraft data to probe the connection between stellar structure and stellar activity.
Peering into the Interiors of Stars
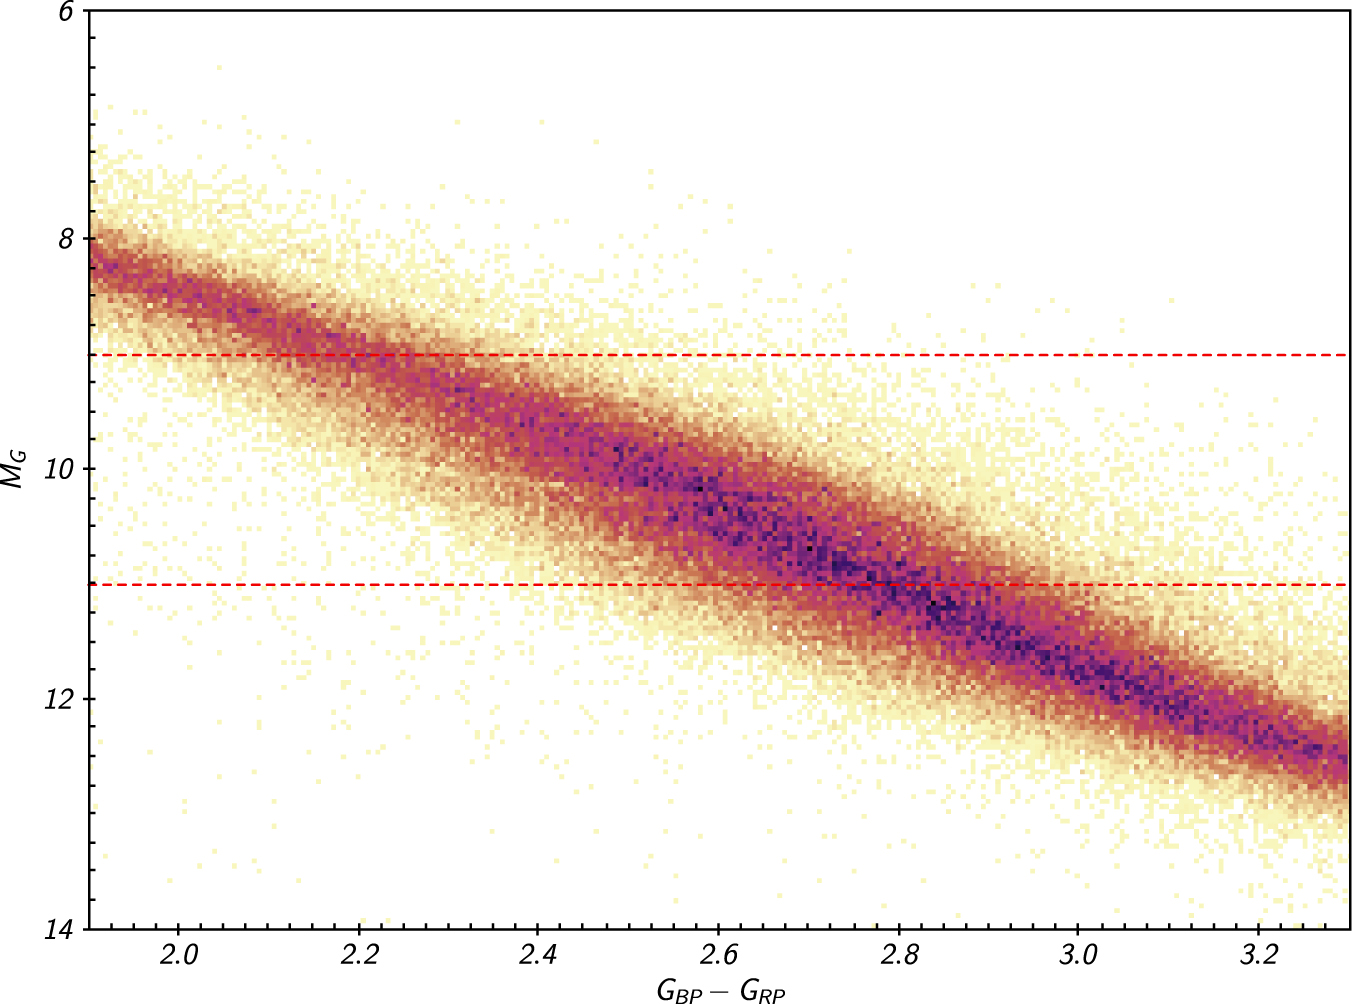
Absolute magnitude versus color, derived from Gaia spacecraft observations, for low-mass stars within 326 light-years of the Sun. A narrow gap appears where the density of data points is lower. [Jao et al. 2018]
Surprisingly, we may actually be able to see the division between partially and fully convective stars! When plotting the absolute magnitudes and colors of thousands of stars — i.e., creating a Hertzsprung–Russell or H–R diagram — a narrow gap appears where relatively few stars exist. Research suggests that the stars in this gap have complex, unstable interiors and experience pulsations. The instability in these stars may drive large-scale changes to their magnetic fields, which may in turn manifest as stellar activity like starspots and stellar flares.
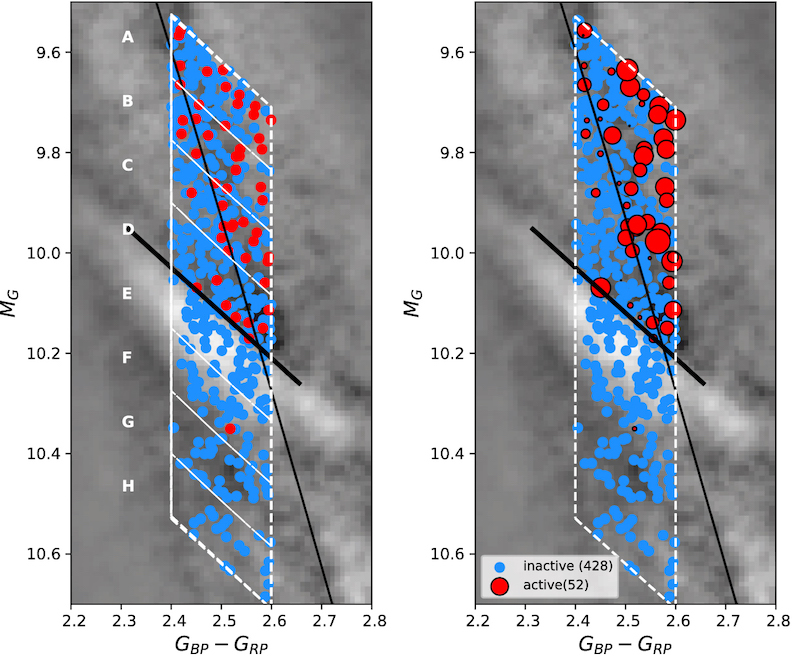
Left: Active and inactive stars in the eight subdivisions within the survey region (white dashed line). The background image has been enhanced to show the location of the gap (region E). Right: Same information, but also showing the equivalent width of the H-alpha line for the active stars. The equivalent width is a measure of the strength of the emission. Note that the two active stars below the gap edge (black line) have tiny equivalent widths. Click to enlarge. [Adapted from Jao et al. 2023]
A Deep Dive into the Gap
A team led by Wei-Chun Jao (饒惟君) from Georgia State University sought to understand how changing internal structure affects stellar activity. The team analyzed spectra of 480 nearby stars within the gap for signs of H-alpha emission, which is correlated with stellar activity. The distribution of stars with and without activity was remarkable: essentially all stars within the gap were inactive, with no H-alpha emission, and nearly all active stars fell above the gap.
To dive deeper into this finding, Jao and collaborators subdivided the stars in their sample into eight groups, four above the gap and four within and below the gap. On average, 15% of the stars above the gap are active, while just 1% of the stars within and below the gap are. This sharp division between active and inactive stars suggests that even though stars in the gap have a variety of internal structures, these variations don’t result in changing stellar activity as theorized.
Another Feature on the H–R Diagram
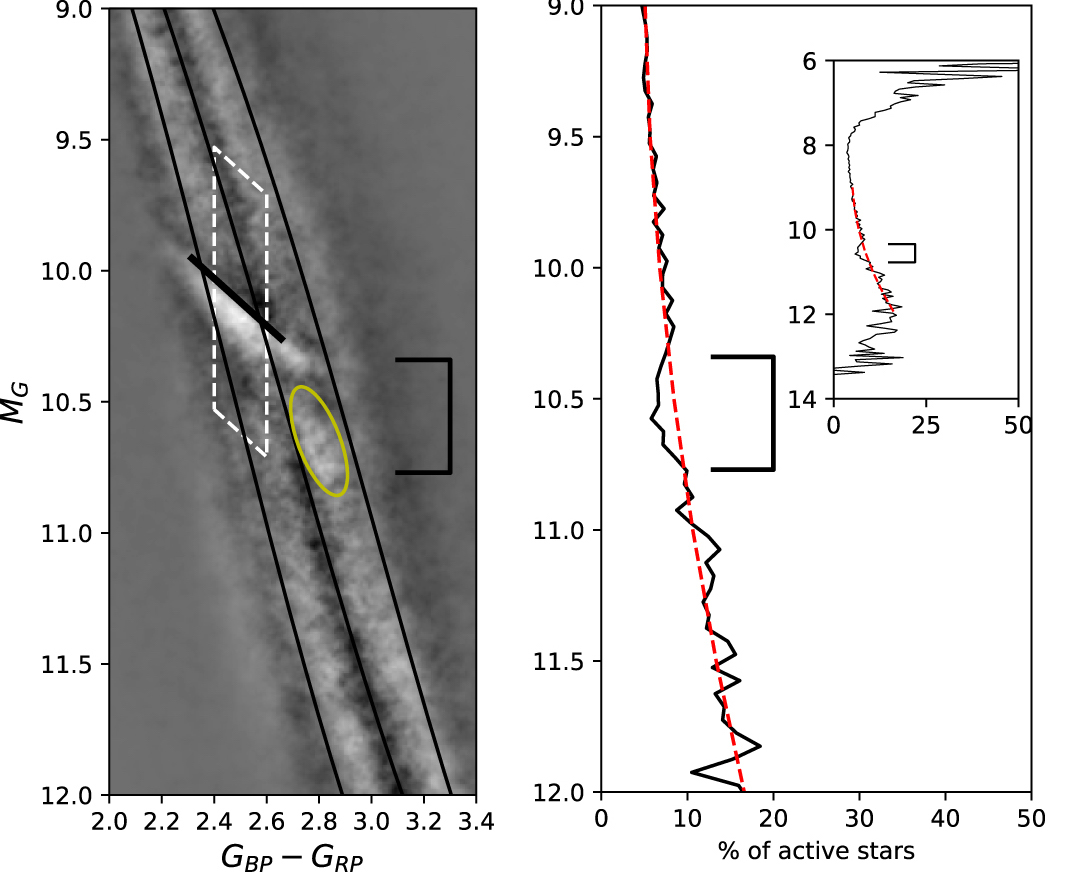
Left: Location of the second density dip and newly identified activity dip (yellow ellipse) relative to the gap and the study region from this work (white dashed region). Right: Percentage of stars showing activity. There is a dip in activity at the location of the yellow ellipse. Click to enlarge. [Adapted from Jao et al. 2023]
Why are stars in this region less active than their neighbors on the H–R diagram? It might be related to stellar rotation, since the stars in the activity dip are less likely to rotate rapidly than stars in surrounding areas on the diagram. This suggests that the most massive fully convective stars quickly spin down to slower speeds, possibly due to stellar winds that carry away angular momentum. Slower rotation means less pent-up magnetic energy and therefore less stellar activity. To investigate this theory further and gain a better understanding of the various gaps and dips on the H–R diagram, we’ll need more measurements of rotation rates and H-alpha emission for fully convective M dwarfs.
Citation
“Mind the Gap. I. Hα Activity of M Dwarfs Near the Partially/Fully Convective Boundary and a New Hα Emission Deficiency Zone on the Main Sequence,” Wei-Chun Jao et al 2023 AJ 166 63. doi:10.3847/1538-3881/ace2bb