
Editor’s Note: This week we’re at the 242nd AAS meeting in Albuquerque, NM, and online. Along with a team of authors from Astrobites, we will be writing updates on selected events at the meeting and posting each day. Follow along here or at astrobites.com for daily summaries, or follow @astrobites on Twitter for live coverage. The usual posting schedule for AAS Nova will resume on June 12th.
Table of Contents:
- Hale Prize Lecture: George H. Fisher (University of California, Berkeley)
- Press Conference: Resolving Stars and Hunting Nearby Galaxies
- Plenary Lecture: Julia Blue Bird (National Radio Astronomy Observatory)
- Press Conference: Hot Jupiters and Hungry Black Holes
- Harvey Prize Lecture: Bin Chen (New Jersey Institute of Technology)
- Plenary Lecture: Linda Shore (Astronomical Society of the Pacific)
Hale Prize Lecture: George H. Fisher (University of California, Berkeley) (by Emma Clarke)
The Solar Physics Division awarded this year’s Hale Prize, which recognizes “outstanding contributions over an extended period of time to the field of solar astronomy,” to George Fisher of the University of California, Berkeley. His talk, “Understanding the Dynamics of Magnetic Field and Plasma in the Interior and Atmosphere of the Sun,” reviewed the contributions to the field by himself and collaborators.
He began by discussing solar flares. First he described what happens when a solar flare occurs. This begins with the reconnection of magnetic field lines in the solar plasma. These newly reconnected field lines are filled with energetic electrons (which we can see due to their collisions with ions in the solar atmosphere and subsequent bremsstrahlung radiation). An enormous amount of energy is released in the reconnection event and transported into the solar chromosphere. An outstanding question many years ago was what happened to the solar atmosphere when heated by the energetic electrons. In 1989, Fisher described the downflows of chromospheric plasma driven by these energetic electrons and developed a generalized theory for the flare-driven chromospheric downflow’s amplitude and time variation. These predicted downflows are now routinely observed. Later, researchers wondered whether the solar flare models could be applied to stellar flares — flares on other stars. Working with Suzanne Hawley, originally a grad student and now a professor at the University of Washington, Fisher applied solar flare models to stellar flares more generally.

An illustration of the regions of the Sun’s atmosphere and interior. Click to enlarge. [NASA/Goddard]
Next Dr. Fisher discussed work on determining which magnetic quantity best correlates with observed X-ray output of active regions on the Sun. With collaborators he found that X-ray output is best correlated with the unsigned (think absolute value) magnetic flux. Despite advances in understanding the relationship between solar magnetic fields and X-ray emission, reproducing an observed X-ray image with simulations has been a challenging problem; observed and computed images still do not show compelling agreement. Fisher and collaborators speculate that the main cause of the disagreements is in how the coronal loops are heated.
The final part of the talk was about efforts to develop a data-driven physics-based model of the 3D magnetic field above the photosphere. Dr. Fisher explained that such a model would require (1) a model for the evolution of the 3D magnetic field — such as a magnetohydrodynamic model or magnetofrictional model — and (2) a method to derive the electric field and/or velocity field from the photospheric magnetic field data in order to implement Faraday’s law, which describes the evolution of the magnetic field in time. Dr. Fisher discussed the challenges of the second requirement. While velocity along the line of sight can be determined with Doppler shift methods, the other two “horizontal” components are more difficult to estimate. In 2008, Fisher and Welsch developed the FLCT code, based on the Local Correlation Tracking (LCT) technique, to find the horizontal components of the velocity from magnetogram data. Their code can construct the velocity field using two images taken at slightly different times. FLCT has been applied to find flows in many different settings, some of which Fisher never imagined it would be used for! Two applications that he found surprising were deriving streamline maps of the flows and deriving proper motion flows from nebula images taken years apart.
The other approach to the second requirement is to determine the electric field. One option is to compute the poloidal–toroidal decomposition electric field from all three components of the magnetic field. Fisher and collaborators do this using a technique called PDFI, which stands for “poloidal–toroidal decomposition (PTD) plus Doppler plus Fourier local correlation tracking (FLCT) plus ideal.” Fisher says that this technique does a “pretty decent job” of reproducing the electric field. The electric field has now been computed using PDFI for most emerged active regions observed by the Solar Dynamics Observatory.
Dr. Fisher concluded by sharing his excitement for solar physics research and the many unsolved problems in the field. He proposed that we are entering a “golden age” of solar physics, especially with regards to solar magnetism.
Press Conference: Resolving Stars and Hunting Nearby Galaxies (by Junellie Gonzalez Quiles)
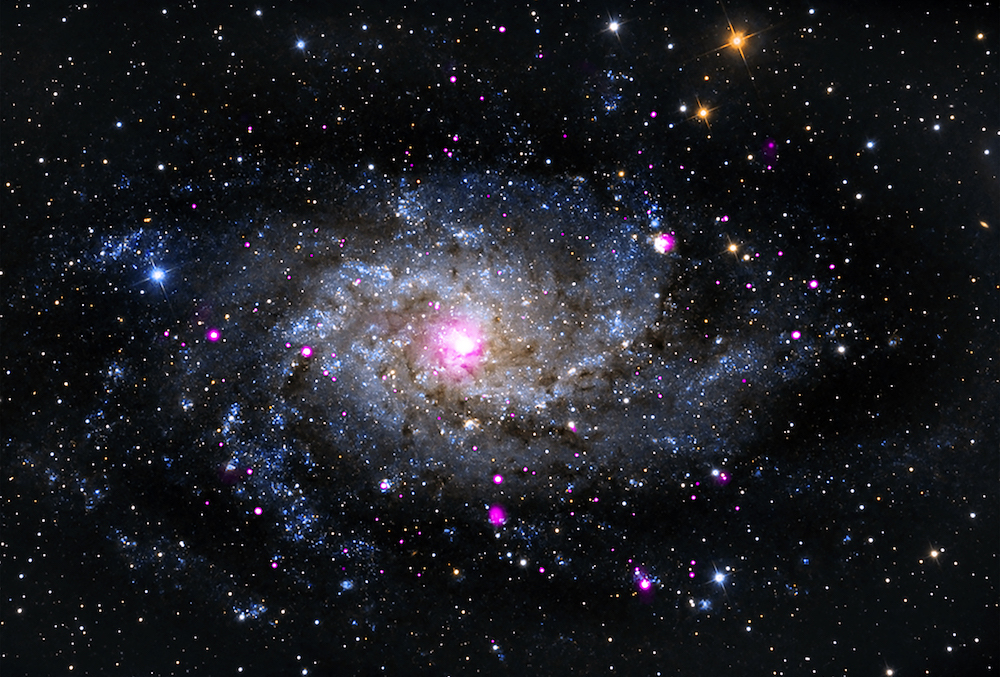
A composite X-ray and optical view of the Triangulum Galaxy. [X-ray: NASA/CXC/SAO/P. Plucinsky et al.]
Next up, we had Jim Jackson from the Green Bank Observatory who talked to us about star formation triggered by an expanding bubble in the Nessie Nebula. The birthplaces of baby stars (protostars) are dense, cold, filamentary molecular clouds. When high-mass (greater than 8 times the mass of our Sun) stars are formed, they put large amounts of energy into the surrounding gas, which ionizes it and forms expanding bubbles (H II regions). This phenomenon drives the main question of the study: does this energetic feedback trigger or hinder star formation? To answer this question, Jackson’s team looked at the Nessie Nebula, an extremely filamentary infrared dark cloud, which is cold, dense, and opaque. The Nessie Nebula also contains the Nessie bubble in which they see a feature that looks like a question mark. They see the expanding bubble, which interacts with the filament and at their intersection they see a luminous protostar. Its location strongly suggests that the collision between the expanding bubble and the Nessie filament triggered star formation. To determine this, they used the Stratospheric Observatory for Infrared Astronomy (SOFIA) and the Australia Telescope Compact Array (ATCA) to observe the Nessie Nebula. Through detection of ammonia, they were able to see that there are signs of shock, which means the expanding bubble is slamming into the filament at supersonic speeds and the collision triggered a star to form. [Press release]
To finish off the press conference, we had Stephen Walker from University of Alabama in Huntsville talking to us about X-ray observations of a group of galaxies falling into the Coma Cluster. X-rays provide us with a view of the hot (100 million K) intracluster medium filling clusters. They allow us to observe how galaxies move and merge into clusters. The team used XMM-Newton to observe the Coma Cluster. They observe the infalling group NGC4839 that has a 1.5 million light-year-long tail behind it, and their new observations are the most detailed of an infalling group! The Coma Cluster is preceded by a shock front traveling at around 3 million mph. Their edge detections show ripples like Kelvin Helmholtz instabilities. Through studying the shape of its tail, they are able to constrain the properties of the gas such as viscosity, which is important for understanding how galaxy clusters grow through mergers. [Press release]
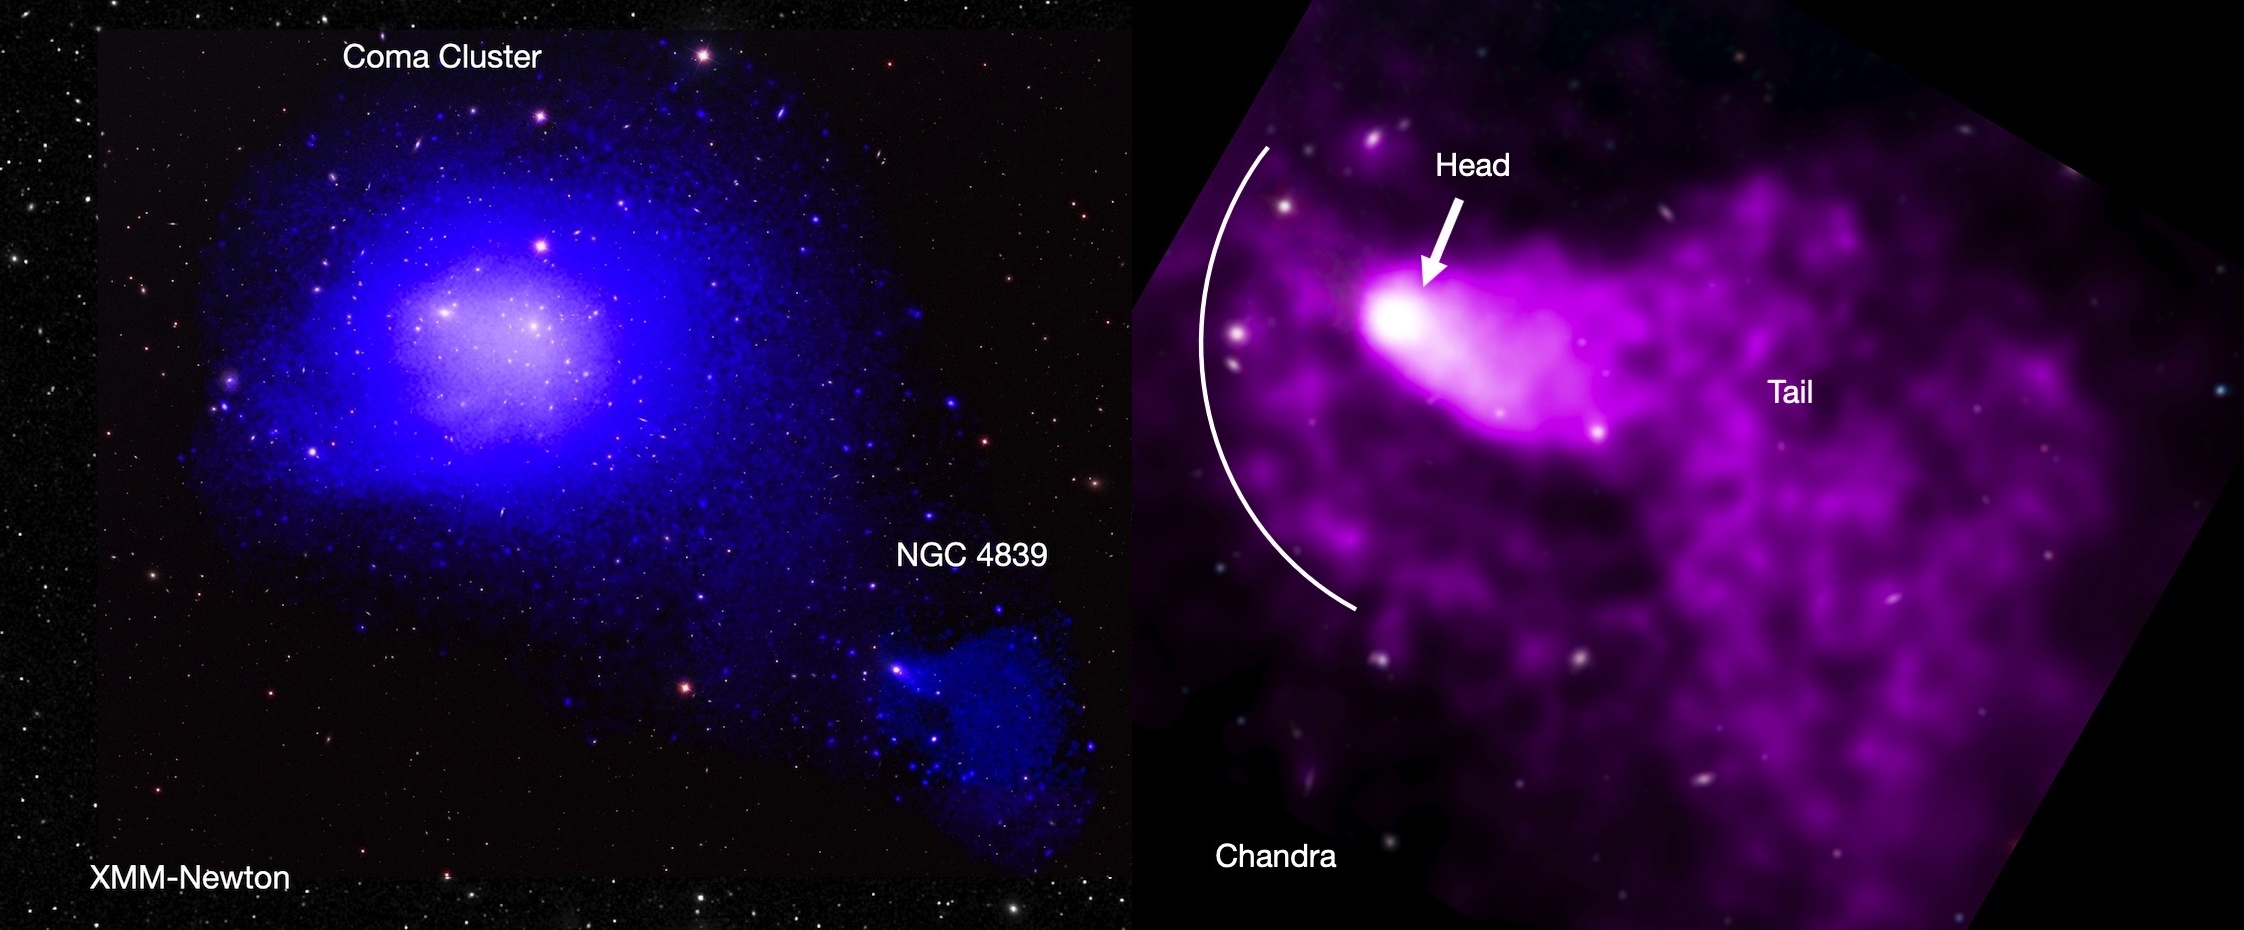
XMM-Newton (left) and Chandra X-ray Observatory (right) images of the Coma Cluster. [From slides by Stephen Walker]
Plenary Lecture: Julia Blue Bird (National Radio Astronomy Observatory) (by Wei Vivyan Yan)
This plenary talk today was delivered by Dr. Julia Blue Bird from the National Radio Astronomy Observatory, sharing the latest discoveries on galactic properties and evolution with CHILES. Thanks to all the amazing instruments to study both neutral hydrogen (HI) and molecular hydrogen, “It is really an amazing time to be a radio astronomer,” says Dr. Blue Bird.
Dr. Blue Bird first introduced CHILES as “a pathfinder for future radio astronomy surveys.” CHILES is short for COSMOS HI Large Extragalactic Survey, a blind survey on the HI emission using the Karl G. Jansky Very Large Array (VLA), covering the part of the COSMOS field with no strong ratio continuum sources (Figure 1). Since the HI emission line is faint and requires long integration times to observe, HI studies with previous large surveys are mostly limited to the nearby Universe (up to z = 0.06). Anything beyond z = 0.25 is considered high redshift. With a 1000-hour single pointing, CHILES could observe the HI line up to z = 0.5, which is a huge step forward.
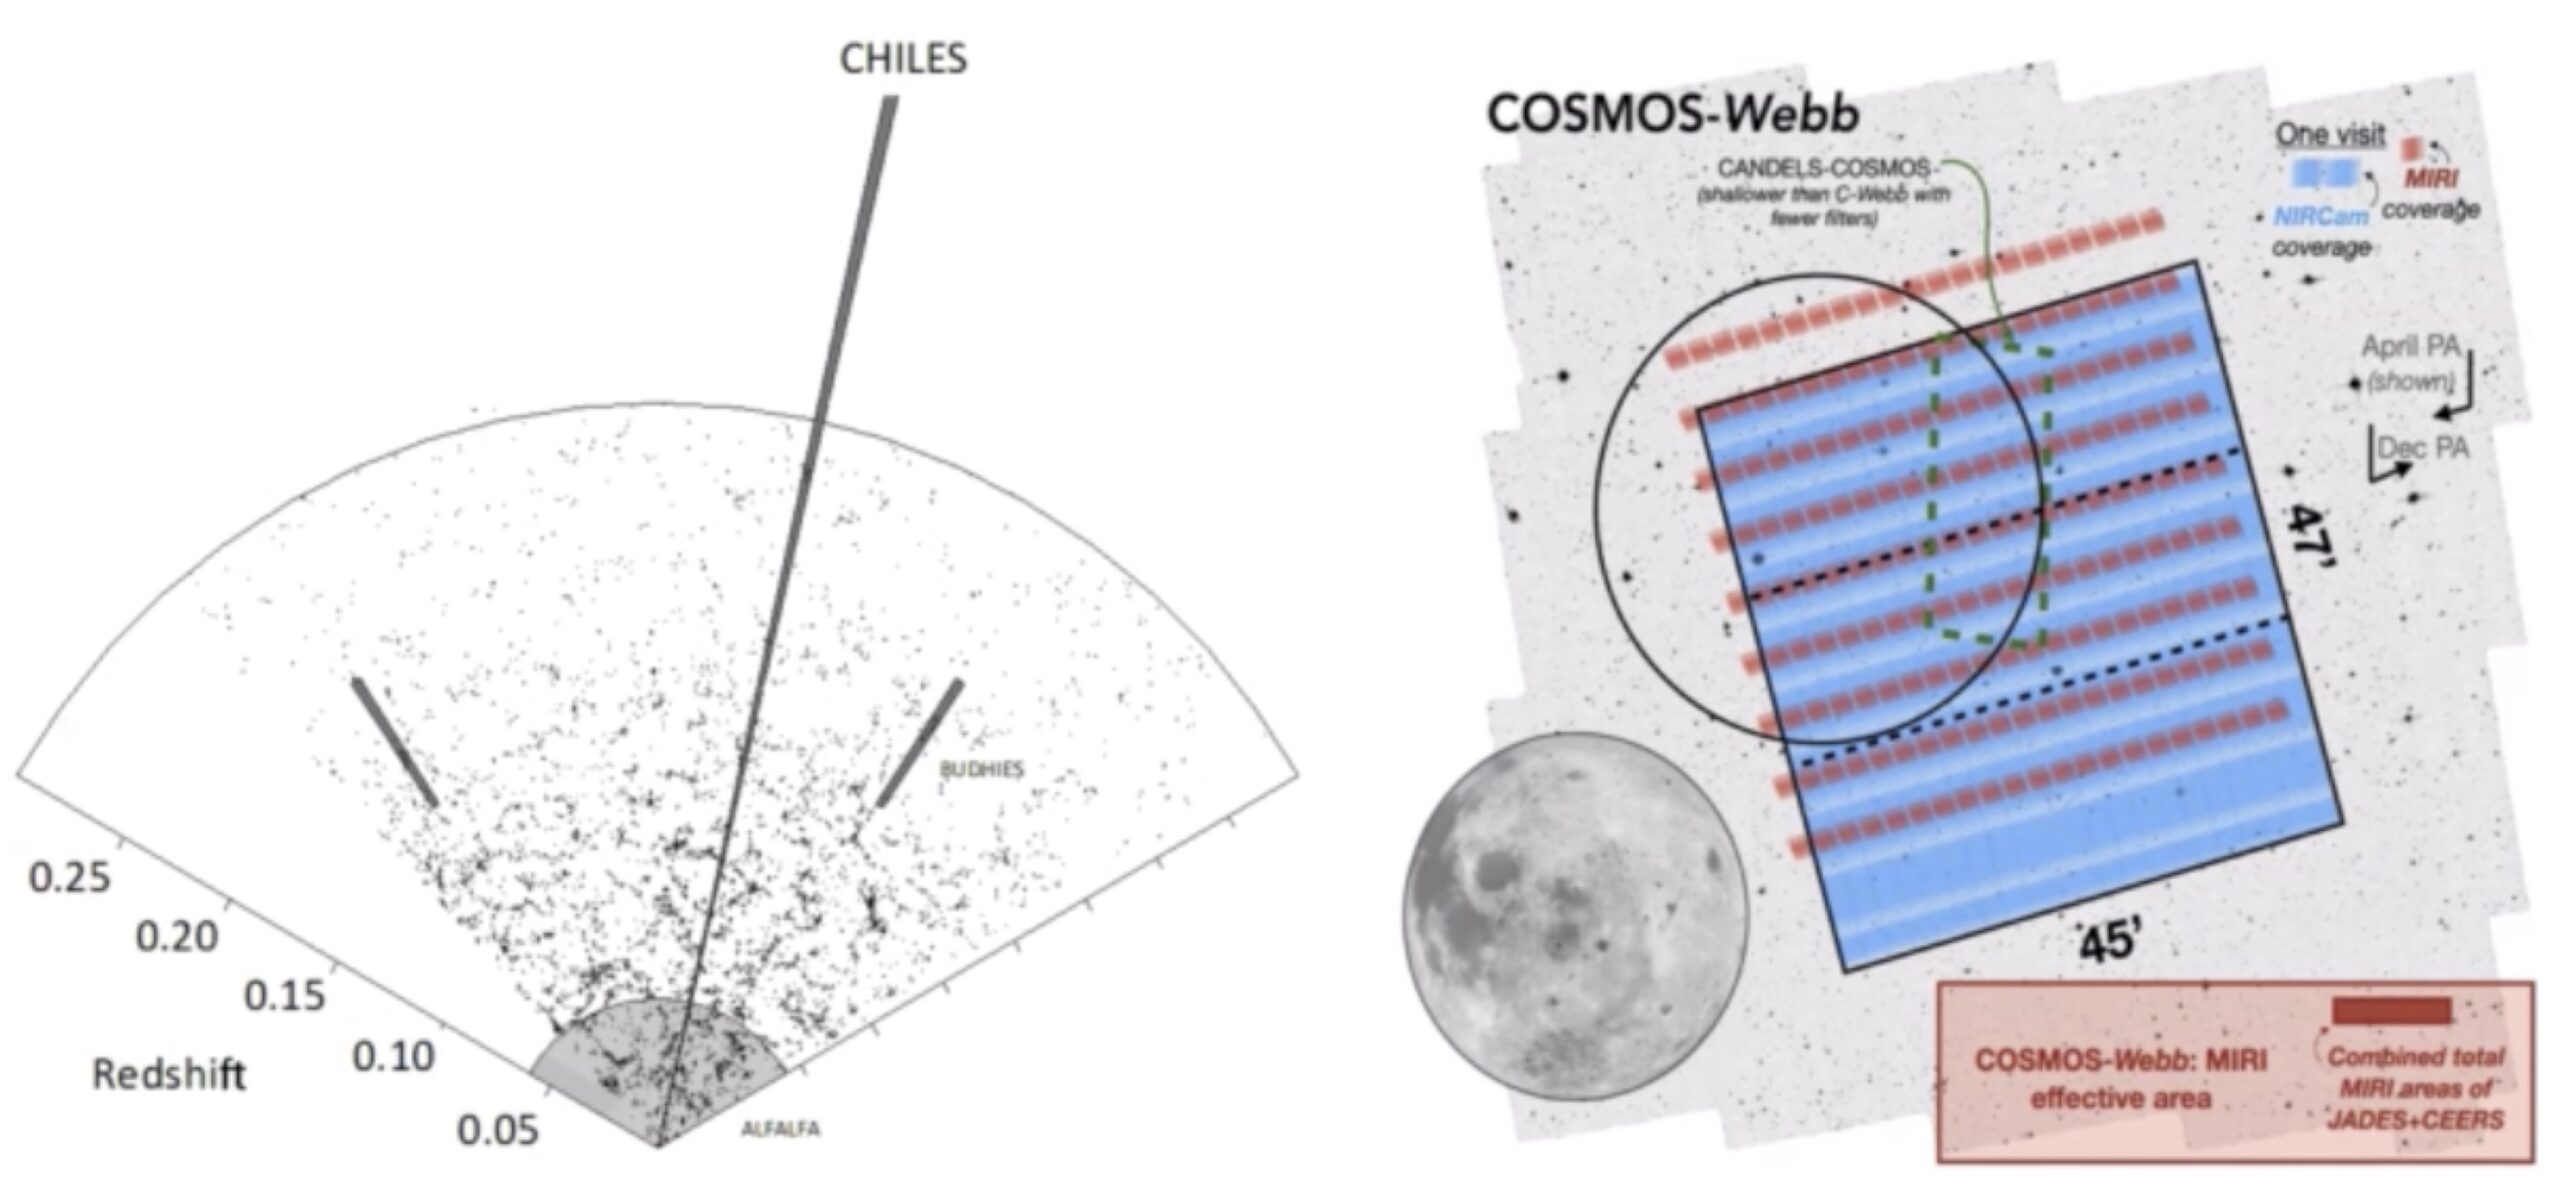
The redshift (left) and sky coverage (right, black circle, as big as the Moon) of CHILES. [Slide by Dr. Julia Blue Bird]
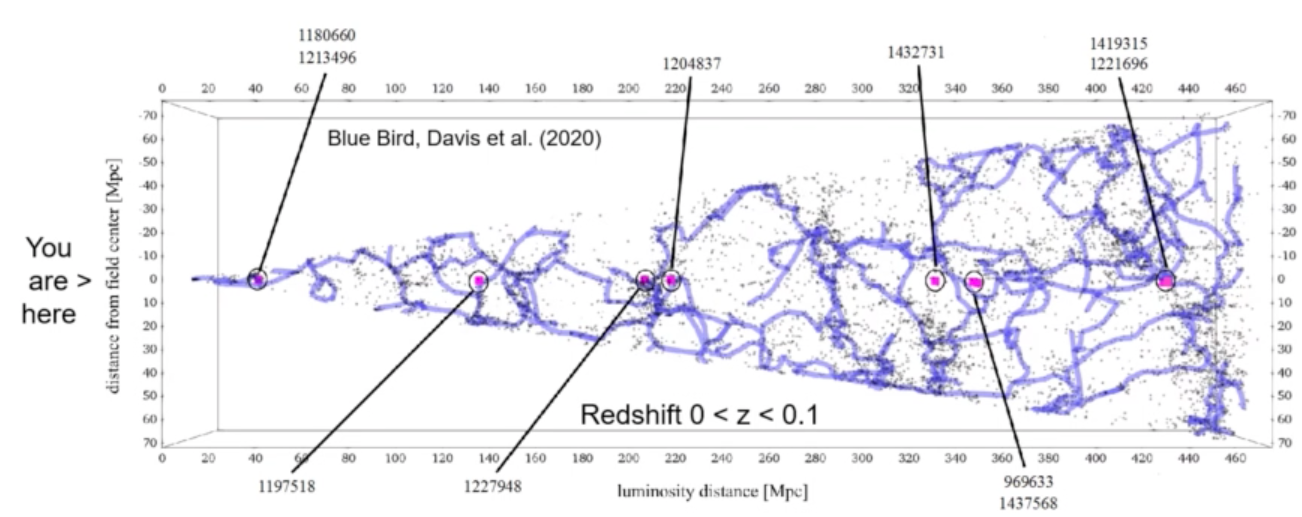
CHILES observed the filamentary network of the cosmic web at z < 0.1 The blue filament lines overlaid the distribution of galaxies (top-down view). [Slide by Dr. Julia Blue Bird]
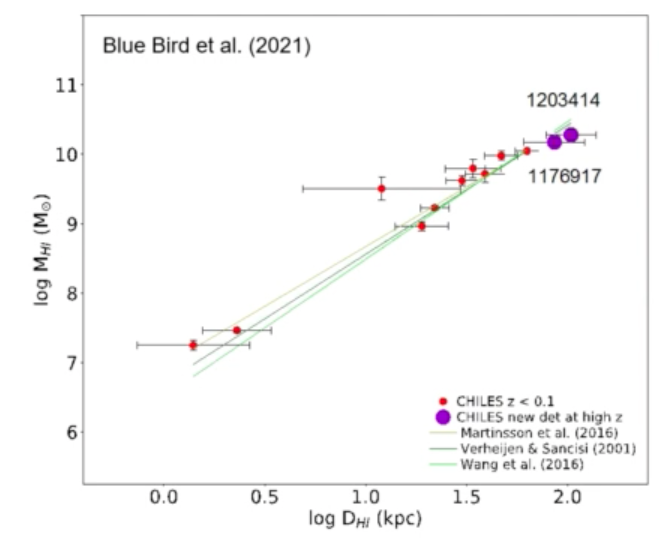
Very tight correlation between HI mass and disk diameter values directly from CHILES data (Dr. Blue Bird’s favorite scaling relation!), suggesting a nearly constant HI surface density. Click to enlarge. [Slide by Dr. Julia Blue Bird]
At higher redshift, Dr. Blue Bird also found some fascinating individual sources at high redshift. For example, a very exciting starburst galaxy at z = 0.38 observed with CHILES shows a large amount of CO and a surprisingly high star formation ratio. More like galaxies at z > 2! Although most detections of individual distant galaxies are generally limited compared to nearby galaxies, stacked spectra of those distant samples can demonstrate the average properties at high redshift. Stacked gas fraction seems to rise along higher redshifts, indicating a possible evolutionary trend. More tests are needed for these hints of the galaxy evolution!
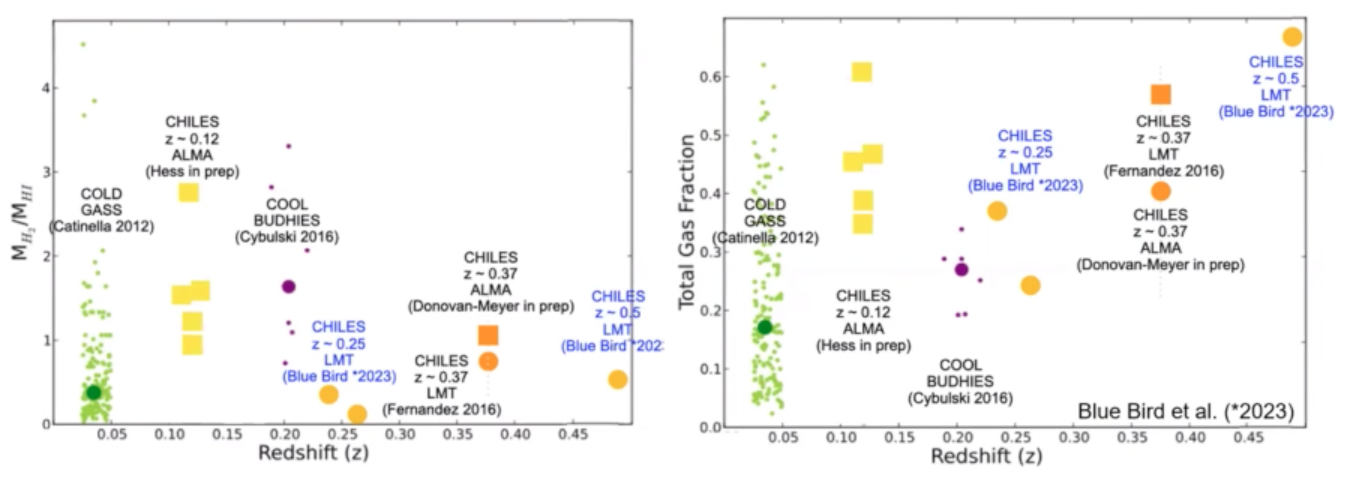
CHILES filled in gaps of missing data points. [Slide by Dr. Julia Blue Bird]
Live tweets of this session by Wei Vivyan Yan.
Press Conference: Hot Jupiters and Hungry Black Holes (by Lucas Brown)
Today’s second press conference was massive — ranging from investigations of massive Jupiter-like exoplanets and explosive nova events to new observations of a famous black hole binary and studies exploring the behavior of supermassive black holes in cosmic voids.
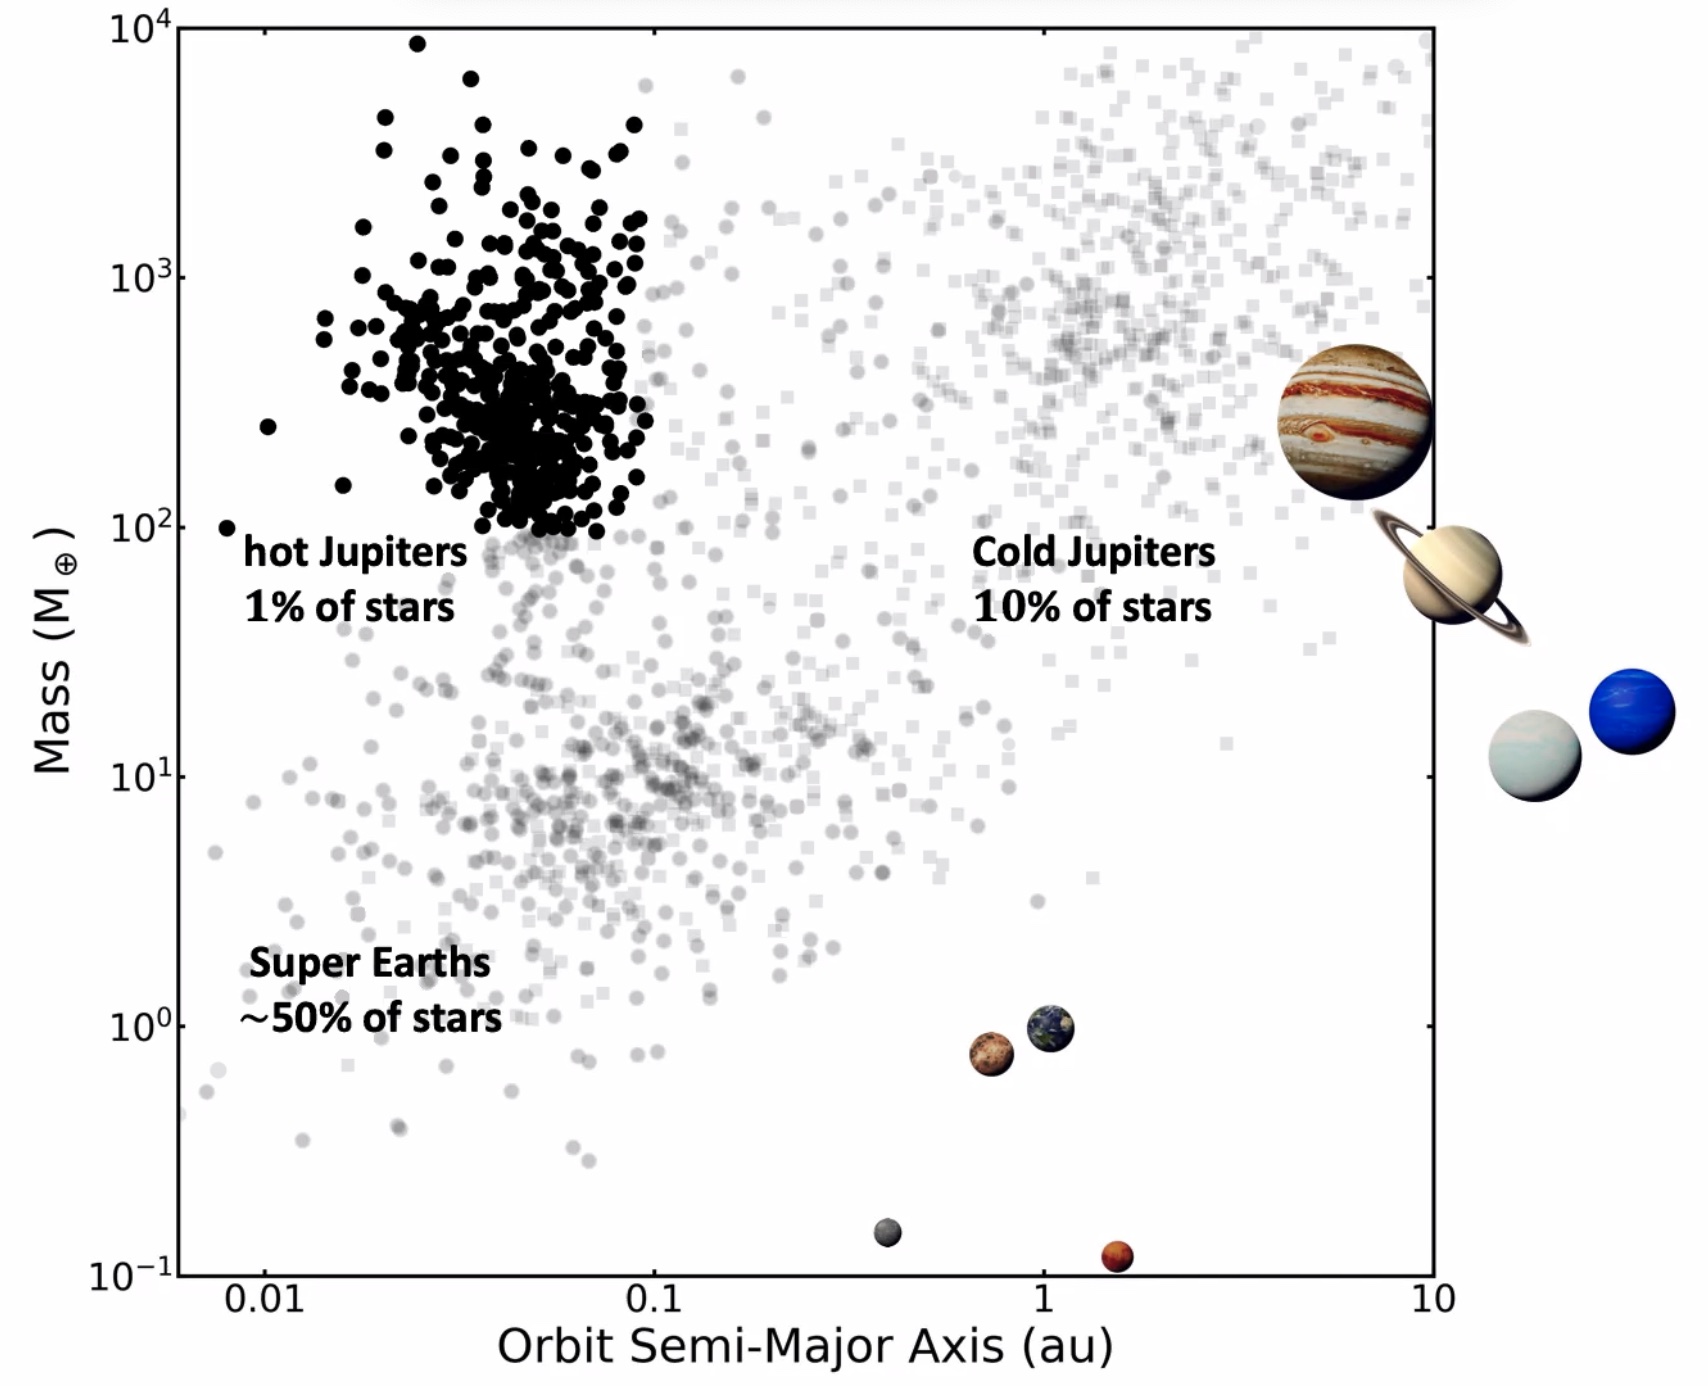
Plot showing the semi-major axis versus mass for planets within our solar system as well as the observed population of exoplanets. “Hot Jupiters” are exoplanets with small semi-major axes but large masses, and they appear in this plot towards the top left. It is not completely understood how these planets migrated to be so close to their host stars. Click to enlarge. [Songhu Wang]
Next up was something much hotter than a hot Jupiter — a nova! Montana Williams from New Mexico Tech presented on new observations of a particularly strange nova. A nova is an astrophysical event that occurs when hot plasma accreting onto a white dwarf in a binary star system becomes hot enough to temporarily sustain a fusion reaction. The nova in question, dubbed V1674H, was imaged by a collection of radio telescopes collectively known as the Very Long Baseline Array (VLBA). This event was remarkably fast for a nova, as it dimmed 2 magnitudes over the course of just around one day. This observation marked only the second time a system like this was observed using the VLBA, and as a result the researchers were able to learn about the structure and dynamics of the ejected stellar material.
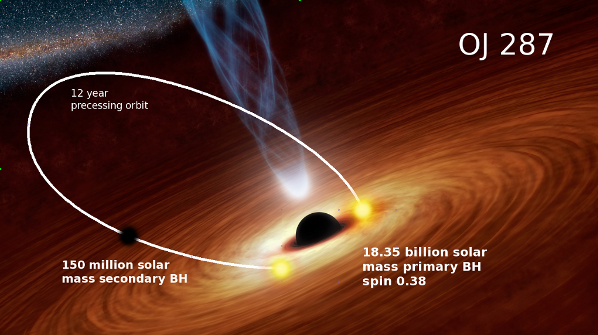
Artist’s impression of the OJ287 black hole binary system. When the smaller secondary black hole crosses the accretion disk of the primary black hole, the system increases in brightness. [S. Zola & NASA JPL]
Following the theme of hungry black holes accreting gasses, the final presentation of the day was a report on initial results from a research project lead by Anish Aradhey, a student at Harrisonburg High School, on the properties of supermassive black holes (SMBHs) at the center of galaxies in cosmic voids. Cosmic voids are huge underdense regions that occupy around 50% of the universe’s volume while containing less than 20% of the universe’s galaxies. The motivation for this work was to explore the hotly debated theory that galaxy interactions and mergers cause central SMBHs to accrete more material (or as Aradhey puts it — ”snacking”). Galaxies in cosmic voids are the loneliest of them all, so they provide an interesting point of comparison for this theory. Aradhey and his team used more than 8 years of NASA WISE data to look for the variability of mid-infrared light galaxies, which is a different method than is commonly employed in looking for “snacking” SMBHs. Typically, measurements are made of a galaxy’s mid-infrared light at one moment, and researchers look for bright red signatures associated with accretion onto SMBHs. This method can misclassify systems which are active but highly variable, so this new work attempts to avoid this issue by focusing on variability in this part of the spectrum. Aradhey and his team ultimately discovered that midsize and dwarf galaxies tend to have more “hungry” black holes in cosmic voids than in the general population, possibly because their isolation allows gas to more efficiently transfer to the center. On the other hand, central SMBHs appeared less active in the cosmic voids for larger galaxies.
Live tweets of this session by Lucas Brown.
Harvey Prize Lecture: Bin Chen (New Jersey Institute of Technology) (by Sumeet Kulkarni)
Every year, the AAS Solar Physics Division awards the Karen Harvey Prize to an early-career scientist who shows outstanding productivity within ten years of their dissertation. This year’s winner is Dr. Bin Chen, an associate professor of physics at the New Jersey Institute of Technology. Chen gave a plenary talk on using the Sun as a laboratory to study some of the most energetic plasma physics phenomena.
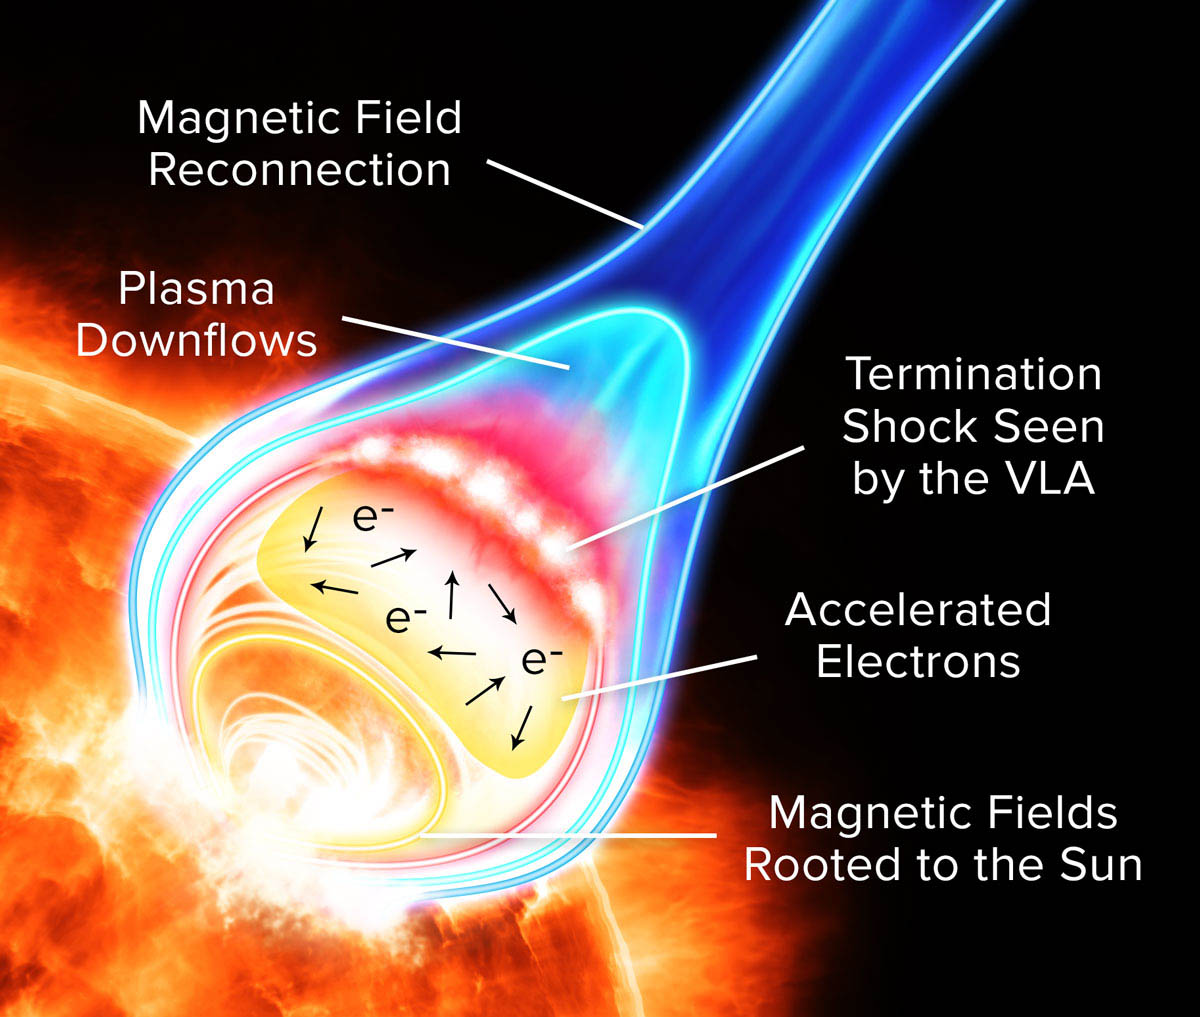
A diagram representing the the shape and structure of a solar flare. [Alexandra Angelich, NRAO/AUI/NSF]
Additionally, we can study the Sun at multiple wavelengths and resolve it extremely well spatially as well as temporally. Chen and his solar physics colleagues have leveraged these abilities to understand solar flares in exquisite detail.
Solar flares release humongous amounts of energy, totalling up to 1032 erg — 10 million times greater than a volcanic explosion. The size of the corona participating in this release is equivalent to a large fraction of the size of the Sun, with the flare rising as high as 0.1 times its radius. The cause of this energy release is magnetic reconnection, a process wherein magnetic field lines of opposite poles approach each other, increasing the electric field and current density in a very thin layer called the “current layer.” This process also accelerates particles such as electrons up to very high speeds, close to the speed of light. Combining theoretical models and observations using the Very Large Array (VLA) and the Expanded Owens Valley Solar Array (EOVSA), Chen has added new insights to where and how this particle acceleration occurs in solar flares.
According to current theoretical models, a standard solar flare forms a long and thin current sheet that tapers in the middle, leading to high velocities of particles in this region. EOVSA can take frequent, broad-band microwave spectra of solar flares, from which it is also possible to distinguish spectra coming from within each region of a flare. This helps us study how magnetic fields vary within the flare structure.
Based on these data, Chen said the magnetic field profile of the observed current sheet matched very well with theoretical models. The field had a local maximum (around 500 Gauss) and minimum (called the “bottle”). The bottle portion had a lower magnetic field at the center surrounded by high fields at two ends. But unexpectedly, the spot with the maximum high magnetic fields has lower concentrations of energetic electrons, which are more prevalent in the bottle region.
Magnetic reconnections are seen in other places too: the Tokamak nuclear fusion prototype reactor and neutron stars. But they are especially important with planetary magnetic fields such as the Earth’s magnetosphere, which protects our atmosphere from evaporation due to solar winds and is thus crucial to sustaining life on our planet.
That is why it is important to study this physical process in further detail. Chen said the future observatories such as the Frequency Agile Solar Radiotelescope (FASR) would have the ability to resolve the shapes of solar flares like never seen before, as seen in the simulated image below. It is sure to flare up as many new questions as it answers!
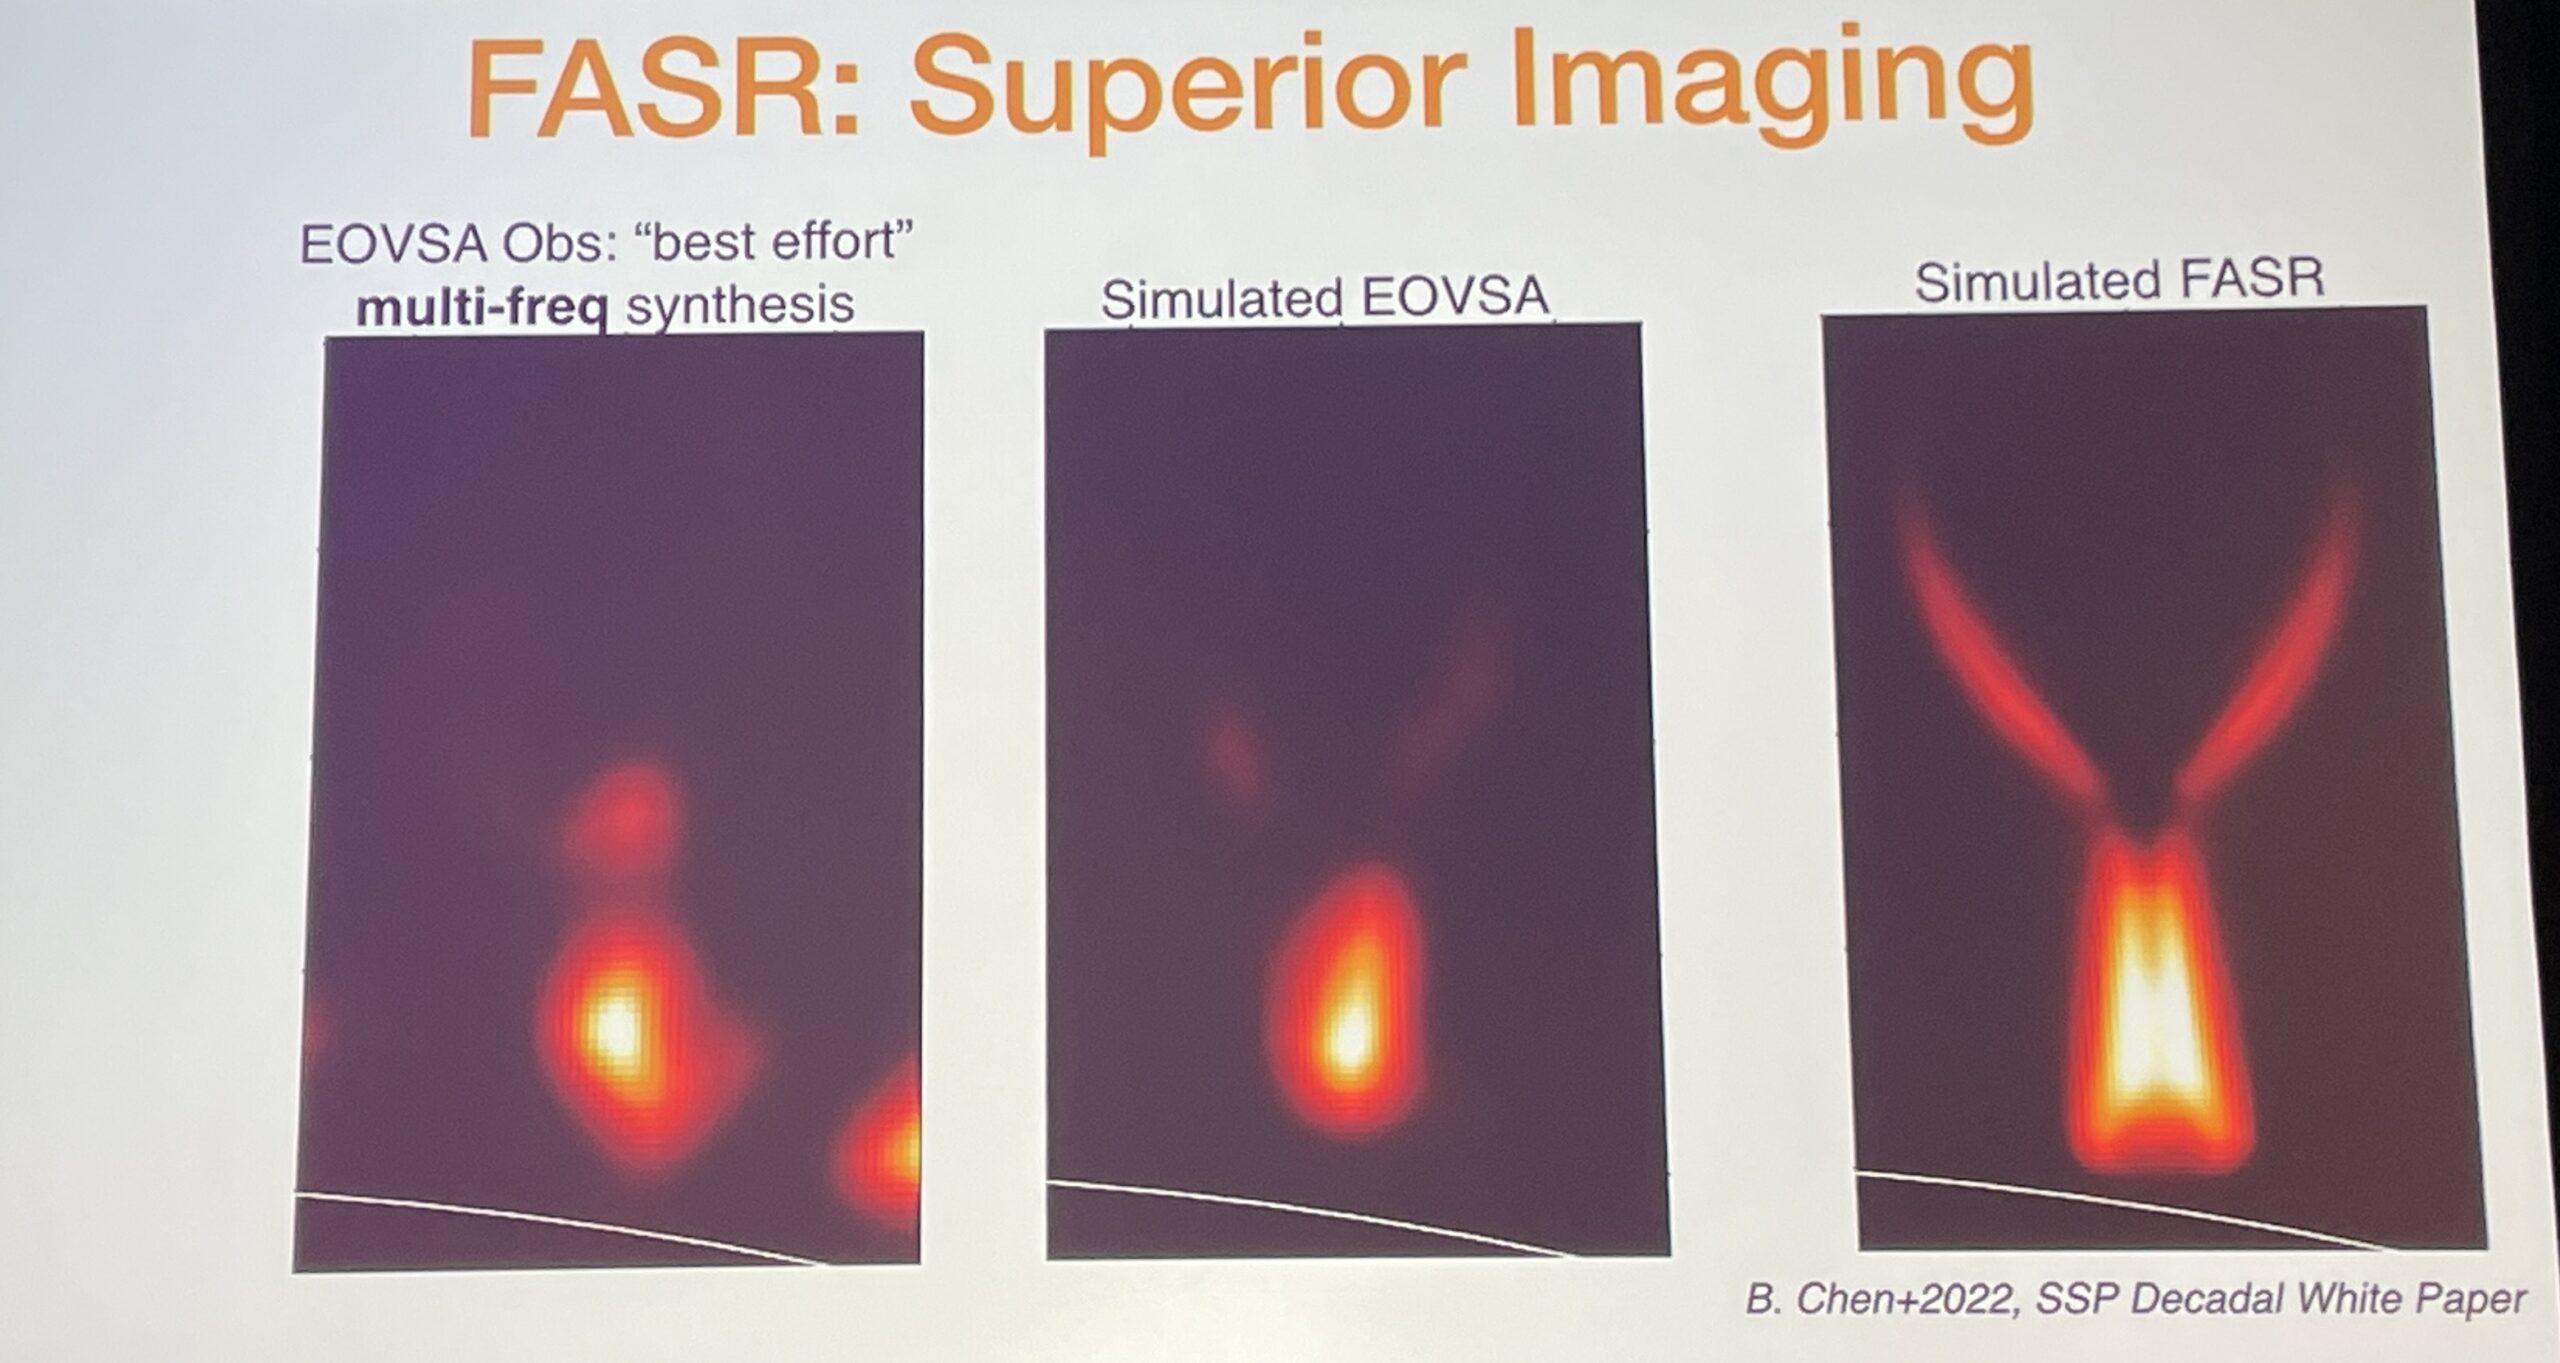
A comparison of EOVSA observations and simulated observations of solar flares using the proposed FASR telescope [Slide by Bin Chen]
Plenary Lecture: Linda Shore (Astronomical Society of the Pacific) (by Ben Cassese)
The final plenary of the day offered something new for those who remained in the largest exhibition hall into the early evening: a talk not on astronomy research, but on public outreach and science communication. Dr. Linda Shore, the CEO of the Astronomical Society of the Pacific and winner of the 2023 AAS Education prize, split her time between a discussion of principles on how to effectively communicate with the public and anecdotes/examples from throughout her career as an educator.
After noting that science communication is more important than ever in the age of misinformation and proliferating conspiracy theories, Dr. Shore shared three keys to effective science education: all activities, whether hands-on museum demonstrations or sit-down lectures, should aim to foster participants’ Science Identity, Science Agency, and Science Capital.
An effective way to hit all three areas is to let participants explore somewhat on their own and reach a conclusion through their own questioning. The Exploratorium, a museum in San Francisco where Dr. Shore worked for many years before joining the ASP, takes this concept to the extreme. From the moment they arrive, guests of all ages are presented with interactive exhibits that come with very few instructions. For example, a giant concave mirror that sat along one wall was not accompanied by any text explaining the concepts of basic optics, like a focal point or magnification. Even so, by approaching the mirror from different directions at different distances, visitors learned that the image flipped and warped depending on their viewing geometry. Many also discovered that sound behaves like light and can be focused as well, allowing them to whisper to a friend across the hall if they stood just the right distance from the mirror.
Although the Exploratorium educates the public about science, it also is a hub for teachers to teach teachers. Dr. Shore shared several classroom experiments developed during the long-running Exploratorium Teachers Institute, a forum for teachers to develop their own strategies for effective communication, often under the guidance of veteran teachers who went through the programs themselves.
Short on time, Dr. Shore unfortunately had to skip some of the recent initiatives she has spearheaded for practicing astronomers to better their own science communication abilities. But, they are many, and include the AAS-ASP Ambassadors Program and On-The-Spot Feedback Program.
We thank Dr. Shore for her informative and enjoyable presentation, and congratulate her on the well-deserved 2023 AAS Education Award!
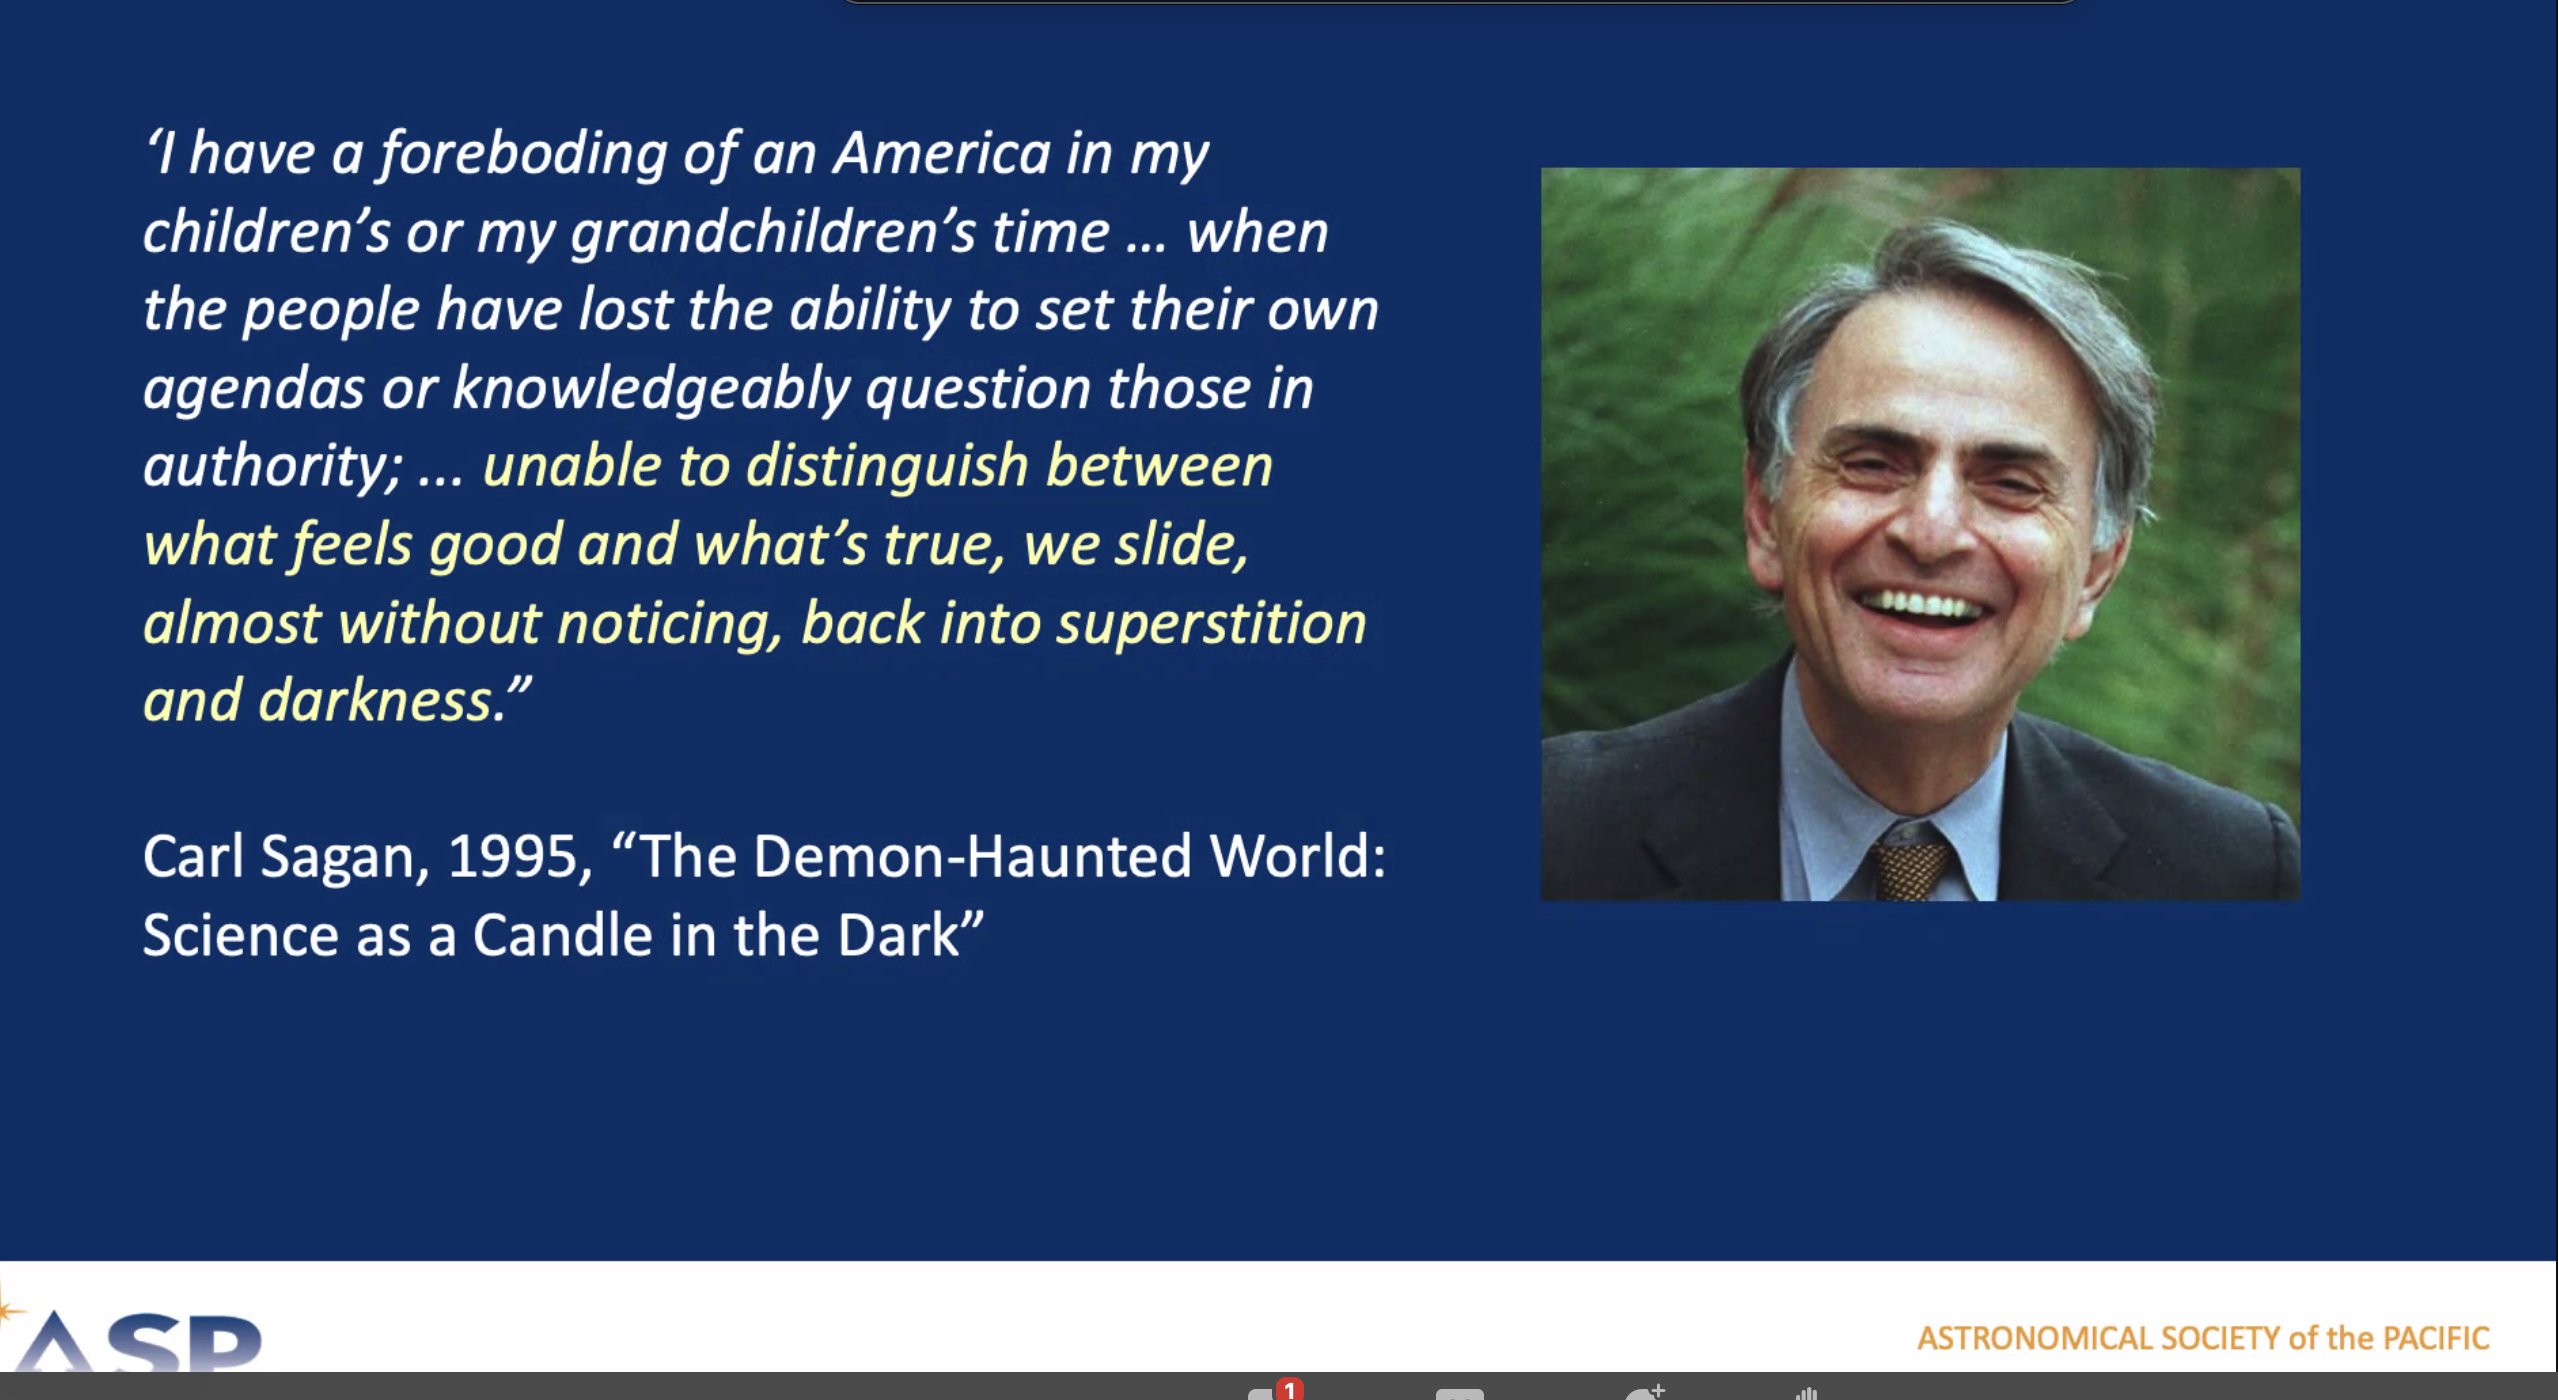
[Slide by Linda Shore]