
There are light curves, then there are light curves. Recently, astronomers untangled a particularly complex signal and revealed its surprisingly elegant cause: not one, two, or even three, but four stars locked into a never-ending dance.
A Mystery Light Curve
Over the past 20 years, astronomers have piled up quite the hoard of stellar light curves. Most of these are predictable, fairly simple time series: sure, the brightness of a given star might oscillate pseudo-regularly around its average as star spots come and go or the star shrinks and swells, but by and large, most curves don’t reveal anything surprising. A handful of exciting curves shelter the telltale signature of a transiting planet. Another handful hosts the unfortunately similar signature of eclipsing binary stars. Almost all of them can be explained by fairly simple models, just one or two stars and their planets going about their usual lives.
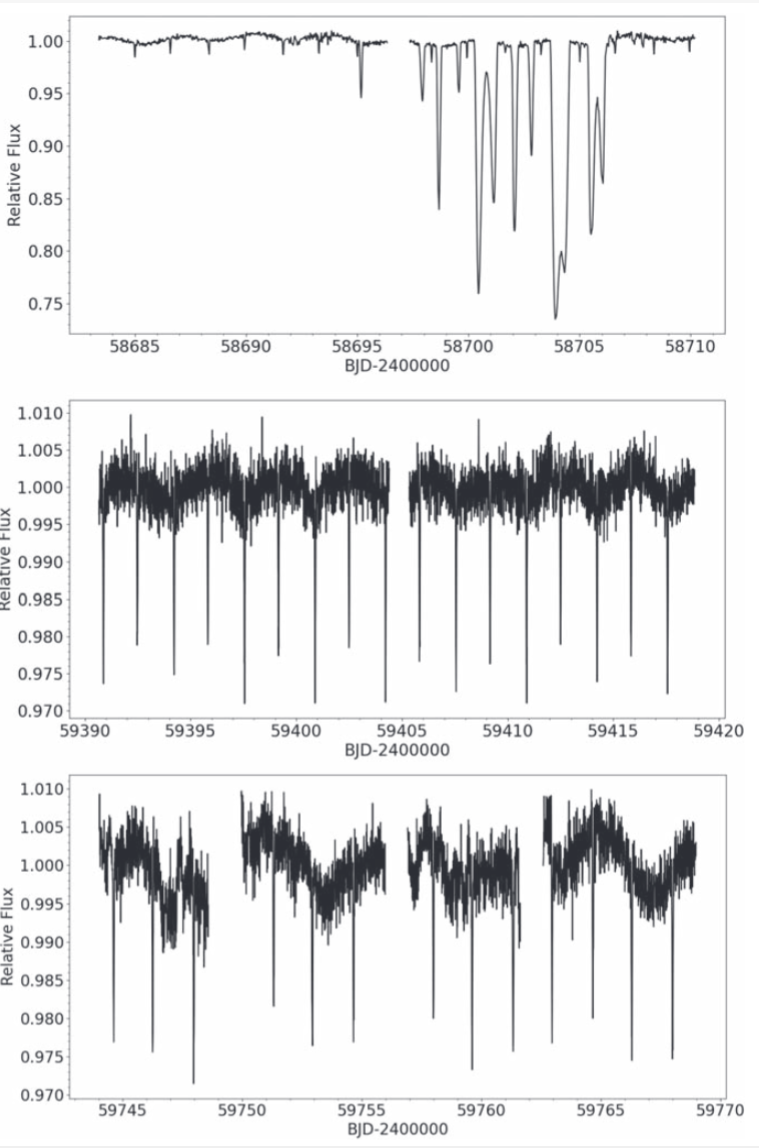
Measurements of TIC 114936199’s brightness over time, as observed in three different TESS sectors. Note the changes to the y-axis scale after the first sector. [Powell et al. 2022]
The second and third of these chunks look like a standard eclipsing binary. But that first stare… What could cause such deep, non-repeating dips?
To find out, a team led by Brian Powell (NASA Goddard Space Flight Center) started looking into arrangements of more and more eclipsing stars to explain how nature could create such strange dips in the first sector but not the others. A few clues led them to consider assemblages of four stars, which had been spotted by TESS before. But actually describing the size, location, and velocities of those four stars proved quite the challenge.
Fitting Challenges
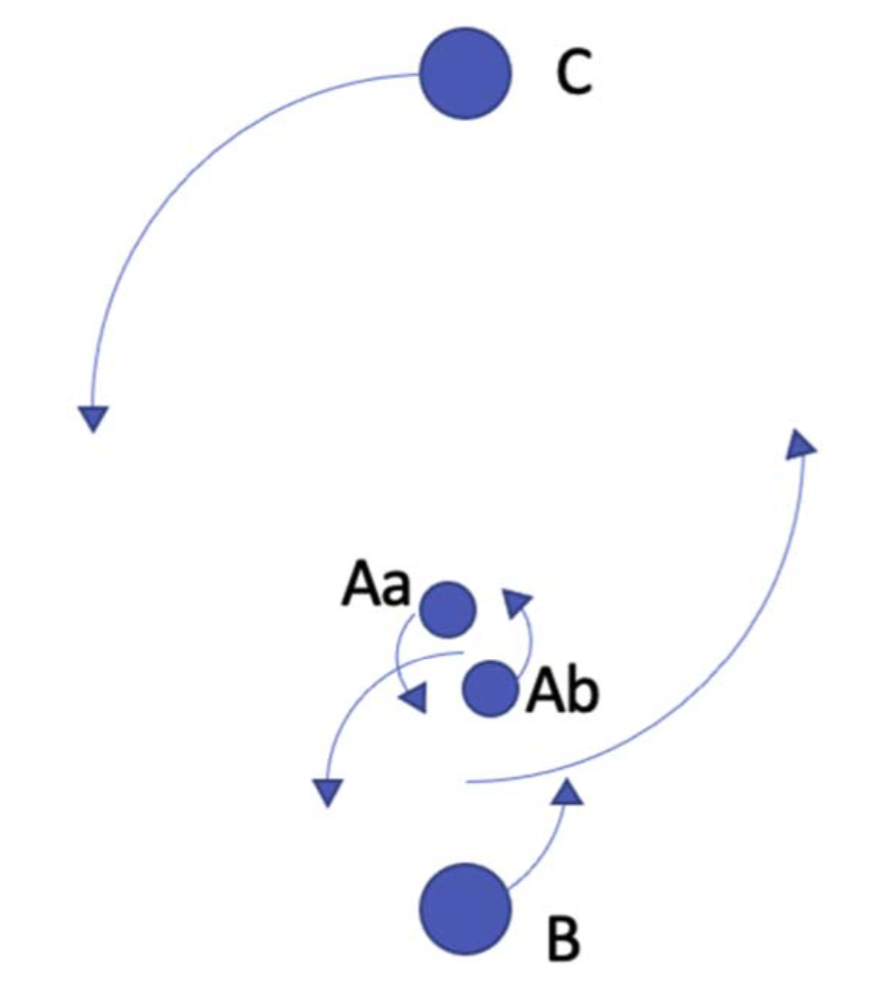
A cartoon illustration of TIC 114936199’s components: four stars all bound together. The deep eclipses were the result of stars Aa and Ab passing in front of star C at the same time. [Powell et al. 2022]
Wandering the landscape of such a broad parameter space, Powell and collaborators found that standard Monte Carlo fitting routines got lost in the hills of local minima and could not find a reasonable solution. The team first increased their computational firepower by switching to a NASA supercomputer, then they deployed other algorithms such as Particle Swarm Optimization and Differential Evolution. In this exploration phase, the team churned through millions of possible combinations over many hundreds of thousands of computing hours.
All of this effort got them within the ballpark of a reasonable solution, and when they sensed they were close, the team again unleashed their fitting algorithm. This time, it made a beeline for their final solution, a configuration of four stars circling three different centers.
Successful Solution
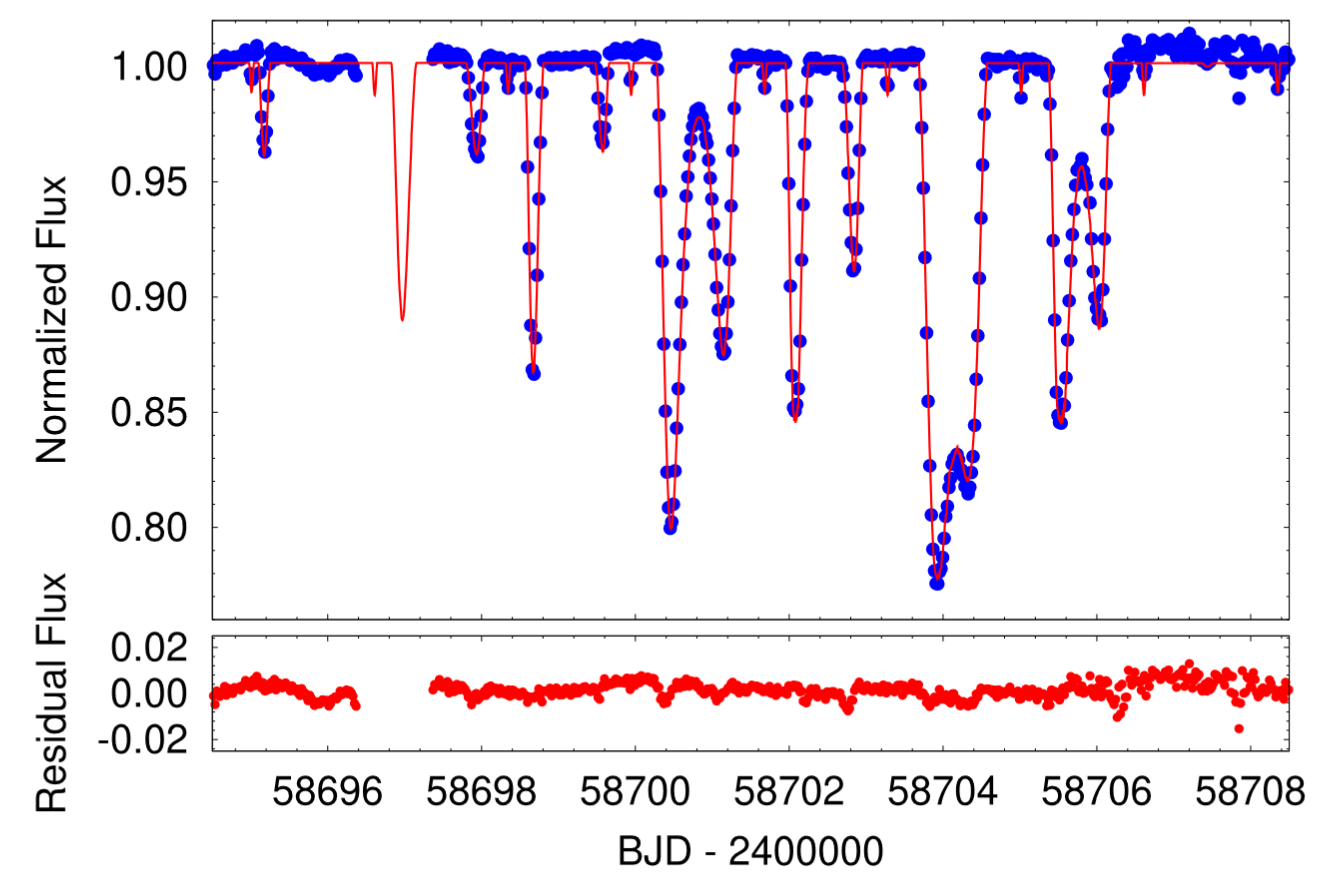
A zoom-in of data from the first TESS sector (blue) compared with the final model (red line). The residuals are shown below the time series. [Powell et al. 2022]
Citation
“TIC 114936199: A Quadruple Star System with a 12 Day Outer-orbit Eclipse,” Brian P. Powell et al 2022 ApJ. 938 133 doi:10.3847/1538-4357/ac8934