 for a New Solar Instrument")
The first data from the Extreme-ultraviolet Snapshot Imaging Spectrograph show that the instrument’s unique design can help capture the behavior of a dynamic region of the solar atmosphere, hopefully helping researchers understand how the Sun’s upper atmosphere reaches its extreme temperatures.
Transition Region Reconnaissance
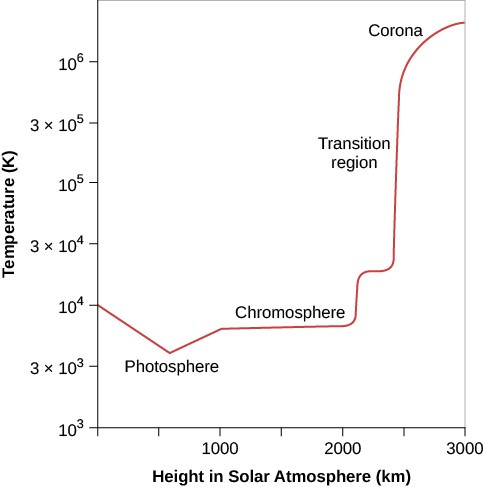
Temperature of the solar atmosphere as a function of height. [Andrew Fraknoi, David Morrison, and Sidney C. Wolff via OpenStax; CC BY 4.0]
Traditional spectrographs struggle to separate spatial and temporal changes in the transition region, since the time needed to map a narrow slit across the region exceeds the region’s rapid variability. Newer slitless imaging spectrographs can capture spectra over a wide area simultaneously, but disentangling the spatial and spectral components of the data can be difficult. In a new publication, a team led by Jacob Parker (NASA’s Goddard Space Flight Center) describes the first flight of a new spectrograph specifically designed to study the dynamic environment of the solar transition region.
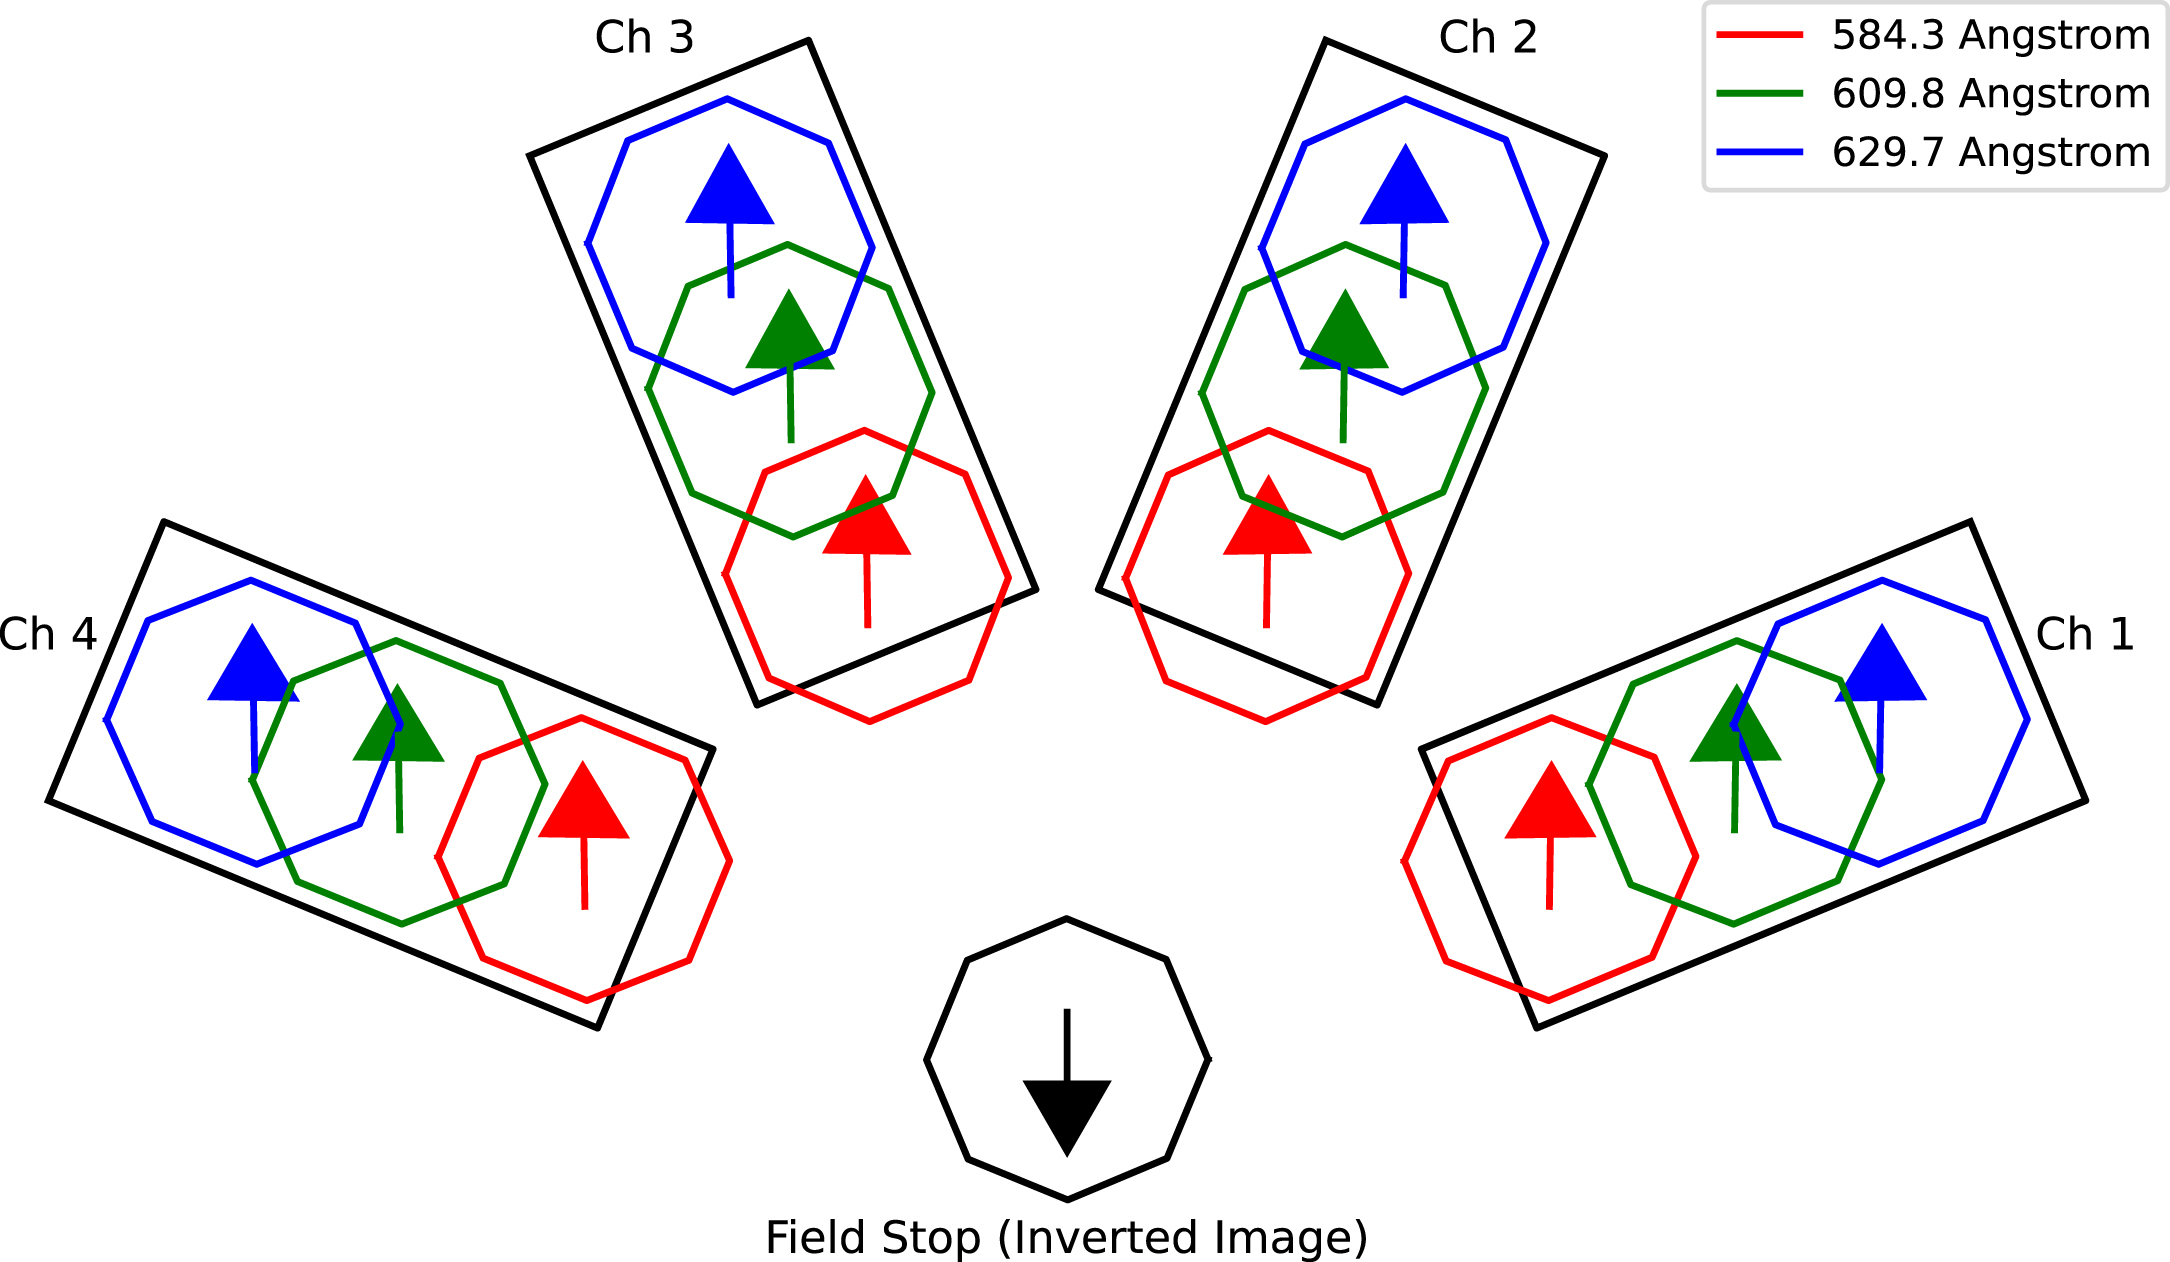
This schematic shows the locations of the octagonal field stop, onto which the mirror (not pictured) focuses sunlight, and the four detectors. The locations of three prominent emission lines on the four detectors are marked with the colored octagons. [Parker et al. 2022]
A New Design
The Extreme-ultraviolet Snapshot Imaging Spectrograph (ESIS) has a novel design that incorporates four diffraction gratings that survey the solar atmosphere at 58.4–63.0 nanometers — a wavelength range suited to capture plasma motions in the transition region. Each grating is paired with a detector, and the varying angles of the four gratings disperse the incoming light at a different angle along each detector.
The ESIS data from each detector can be arranged into a data cube, which records the intensity of the Sun’s radiation as a function of location (two dimensions of the cube) and wavelength (the third dimension of the cube). A “slice” of this cube, then, is an image of the field of view at a single wavelength. The processing steps for this type of data include correcting for effects like vignetting and charged-particle impacts before aligning and combining data from all four detectors into a single data cube.
Event Estimation
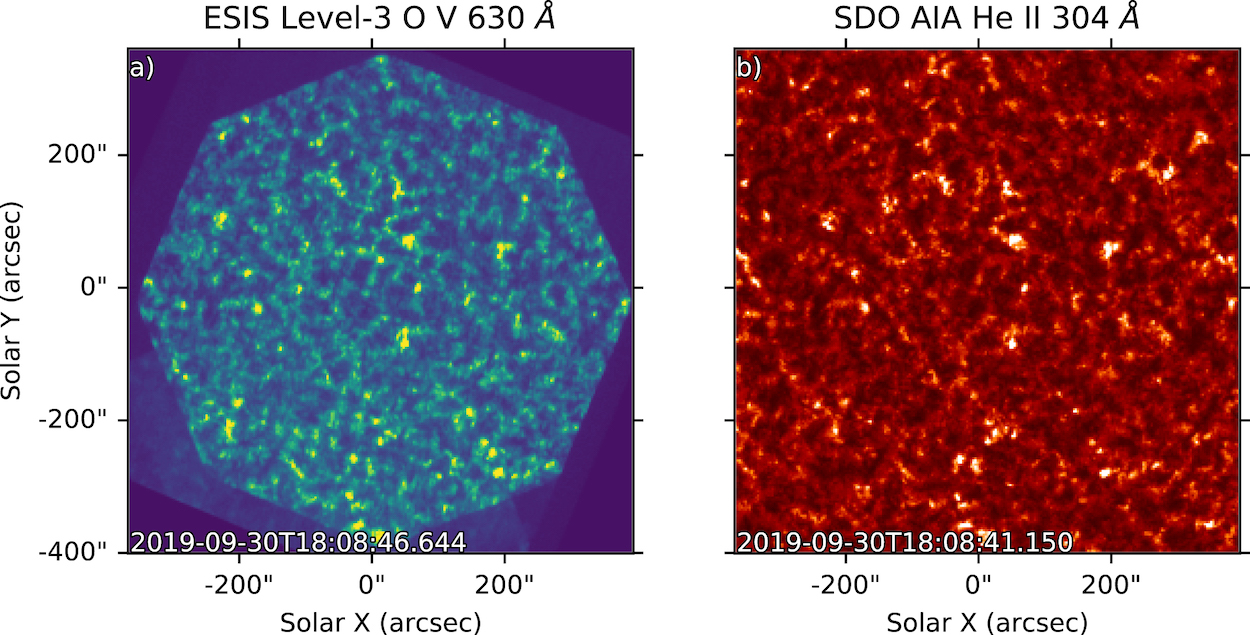
Processed image from a single ESIS detector at a wavelength of 63 nm (left) compared to a 30.4-nm image taken by the Solar Dynamics Observatory’s Atmospheric Imaging Assembly at roughly the same time (right). [Parker et al. 2022]
Future work for the team will involve testing new ways to extract spectral information from the raw observations. Though the work thus far is preliminary, Parker and collaborators have shown that ESIS is able to track small events as they evolve on tens-of-seconds timescales — key to understanding the detailed physics of the solar transition region.
Citation
“First Flight of the EUV Snapshot Imaging Spectrograph (ESIS),” Jacob D. Parker et al 2022 ApJ 938 116. doi:10.3847/1538-4357/ac8eaa