
Editor’s Note: Astrobites is a graduate-student-run organization that digests astrophysical literature for undergraduate students. As part of the partnership between the AAS and astrobites, we occasionally repost astrobites content here at AAS Nova. We hope you enjoy this post from astrobites; the original can be viewed at astrobites.org.
Title: Reionization with Simba: How Much Does Astrophysics Matter in Modeling Cosmic Reionization?
Authors: Sultan Hassan et al.
First Author’s Institution: Flatiron Institute and University of the Western Cape, South Africa
Status: Published in ApJ
While a tired trope to be sure, the hero’s journey to conquer the darkness and bring in an age of light is a memorable one. Today, our hero isn’t a person but succeeds in that illuminating quest all the same!
The authors of today’s article consider one particular question: how do we model the re-emergence of light sources in the early universe during the time of cosmic reionization? Namely, does the way we model the sources of ionizing photons (high-redshift stars and galaxies) impact observables on the large scales relevant for cosmological observations?
That’s a bit of a mouthful, but we’ll chew through it slowly and methodically in this bite!
Out of the Darkness
Before we can talk about reionization, we have to understand what brought about the dark age of the universe in the first place. After the hot Big Bang, the universe was initially fully ionized (all atoms were stripped of their electrons) up until it cooled to the point where hydrogen atoms “recombined” (free electrons paired up with lone protons) at a redshift (z) of roughly 1,000 (Figure 1). After recombination, the universe was filled with neutral hydrogen and was in a sense “dark,” since the cooling universe had no sources of ionizing photons to liberate electrons from the neutral hydrogen (HI).
However, during this dark age the seeds of revolution (ahem, structure formation) were slowly growing until eventually the first stars and galaxies formed inside dark matter halos, providing new sources of ionizing photons. These light-bringers then proceeded to make Swiss cheese out of the dark universe, creating holes filled with ionized hydrogen (HII) as illustrated by the bubbles at the center of Figure 1. You can get an instant and visceral feel for this process by watching this wonderful movie of a simulation of reionization.
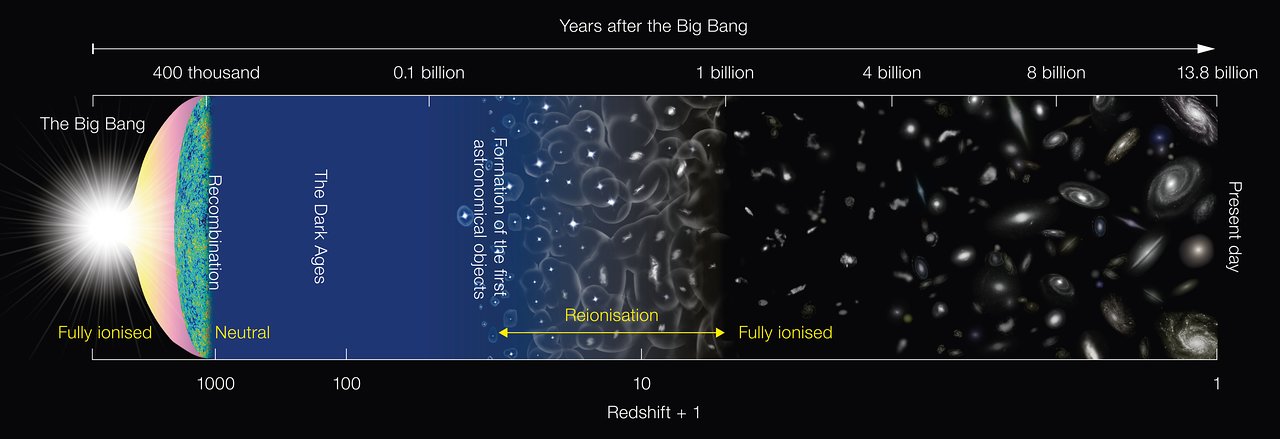
Figure 1: A schematic view of reionization within the larger cosmic timeline. Blue represents (opaque) neutral hydrogen, while black represents fully ionized hydrogen. The transition between these two regimes proceeds around redshift z = 10 by way of reionized bubbles around source stars and galaxies. [NAOJ; CC BY 4.0]
Getting Straight to the Source (Modeling)
The authors set out to understand whether or not the details of how stars and galaxies produce ionizing photons affect observables on large (“cosmological”) scales. To do this, they used the Simba simulations, which include a host of galaxy-formation physics as well as gas hydrodynamics, and accounted for radiative transfer of photons in post-processing. Specifically, the authors tested whether it was possible to notice a difference in the morphology of reionization or in the distribution of ionized hydrogen in the simulation with different choices of source modeling. The results of this comparison are shown in Figures 2 and 3, and we’ll walk through them one at a time.
Figure 2 shows the visual morphology of reionization by displaying the spatial distribution of the ionization fraction xHII (blue is ionized, red is neutral) in the simulation. Each row of Figure 2 corresponds to a different model of ionizing photons. The models contain ionizing photon sources with different properties, in different numbers, or a larger degree of scatter, but each model contains similar overall amounts of photons. The columns correspond to increasing time (and therefore increasing mean global ionization fraction) from left to right.
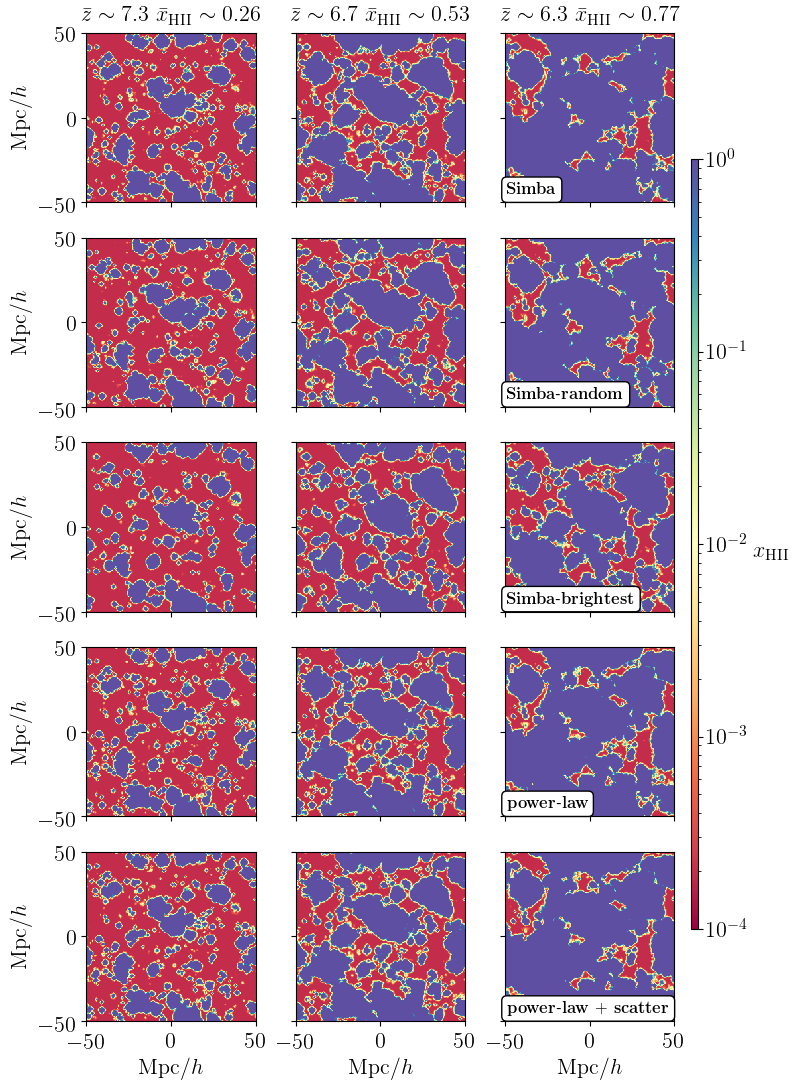
Figure 2: Simulation output maps of ionized hydrogen fraction (xHII) as a function of time (left to right) for several choices of reionization source models (rows). Small features are different by eye in the different models but the overall morphology on larger scales remains the same. [Hassan et al. 2022]
Figure 3 shows the power spectra of ionized hydrogen at the redshifts considered in Figure 2, as well as their residuals in the lower panel. The different modeling choices correspond to the different curves in the figure. The curves are broadly in agreement with each other over most scales for most choices of source modeling. In particular, on large scales (log k < 0.0) the models agree quite well — quantitatively corroborating that the choice of source modeling does not impact the large-scale spatial distribution of the ionized hydrogen.

Figure 3: Reionization power spectra as reionization progresses in time from high to low redshift z (from left to right). For several choices of source modeling considered by today’s authors, the large-scale (low k) power is similar. [Hassan et al. 2022]
Original astrobite edited by Alice Curtin.
About the author, Jamie Sullivan:
I am a third-year astrophysics PhD student at UC Berkeley and part of the Berkeley Center for Cosmological Physics. My current research focuses on measuring and modeling large-scale structure to constrain cosmological parameters. I completed my undergraduate at UT Austin, and I’m originally from the Washington, DC, area.