
Editor’s note: Astrobites is a graduate-student-run organization that digests astrophysical literature for undergraduate students. As part of the partnership between the AAS and astrobites, we occasionally repost astrobites content here at AAS Nova. We hope you enjoy this post from astrobites; the original can be viewed at astrobites.org.
Title: Exploring the Effects of Active Magnetic Drag in a GCM of the Ultra-Hot Jupiter WASP-76b
Authors: Hayley Beltz et al.
First Author’s Institution: University of Michigan
Status: Published in AJ
Love it or hate it, magnetism can influence a whole host of observable astronomical phenomena, especially when it comes to hot gas giant planets. The most extreme of these planets, ultra-hot Jupiters, are tidally locked and have temperatures over 2000K — hot enough to thermally ionise chemical species within the planet’s atmosphere. This process leaves plenty of charged particles ready to interact with the planet’s magnetic field as they get carried by the planet’s strong winds. While there have yet to be any direct measurements of exoplanetary magnetic fields, the fields of ultra-hot Jupiters are expected to be comparable to (if not even greater than) that of Jupiter. With a field strength at its surface of ~4 gauss (G), Jupiter’s magnetic field is already strong enough to extend its magnetosphere beyond the orbit of Saturn, so magnetohydrodynamics should be an important consideration. For example, the Lorentz force created as the ions move through the magnetic fields can result in a drag effect on the circulation within the atmosphere. This magnetic drag can change wind patterns, impacting how easily energy is transported between the ultra-hot Jupiter’s permanent day and night sides.
However, modelling exoplanet atmospheres is a complicated task even before considering magnetohydrodynamics. One of the simplest ways to model magnetic drag forces is via a uniform drag applied to the entire model atmosphere, but this method ignores the potential impact that a planet’s hotter dayside and cooler nightside would have on the forces at play. Today’s article instead uses a locally calculated active magnetic drag, taking into account factors such as the temperature to explore its potential effects.
Modelling Magnetism
For their work, the authors choose to focus on one particular ultra-hot Jupiter, WASP-76b. To model the planet, they make use of a general circulation model to simulate temperature and wind patterns under the influence of magnetic fields with strengths of 0, 0.3, 3, and 30 G. After running the simulations for 2,000 orbits of WASP-76b — enough to allow the atmosphere to reach a steady state — snapshots are taken of the planet so that the magnetic field strengths can be compared.
In the case where no field is applied (0 G), WASP-76b looks like a typical ultra-hot Jupiter, with a strong equatorial wind blowing to the east and a 1500K temperature difference between the day and night sides. The planet’s hottest region is also shifted to the east of its sub-stellar point (the part of the planet closest to the star and therefore receiving the most stellar energy) as expected due to those supersonic winds. This is demonstrated in the first column of Figure 1.
When the planet has a magnetic field, however, the general circulation model snapshot shows a very different picture. For all field strengths, winds high in the atmosphere on WASP-76b’s dayside flow over the poles — a complete change from the 0 G case! The low pressures and high temperatures here cause a drag that counteracts the traditional east–west flow, leaving only the weaker north and south winds. At higher pressures the field strength becomes more important, with the strongest fields able to disrupt the wind deeper into the atmosphere. This poleward flow isn’t a behaviour seen when using the simpler uniform drag method and could have some observable consequences for the planet.
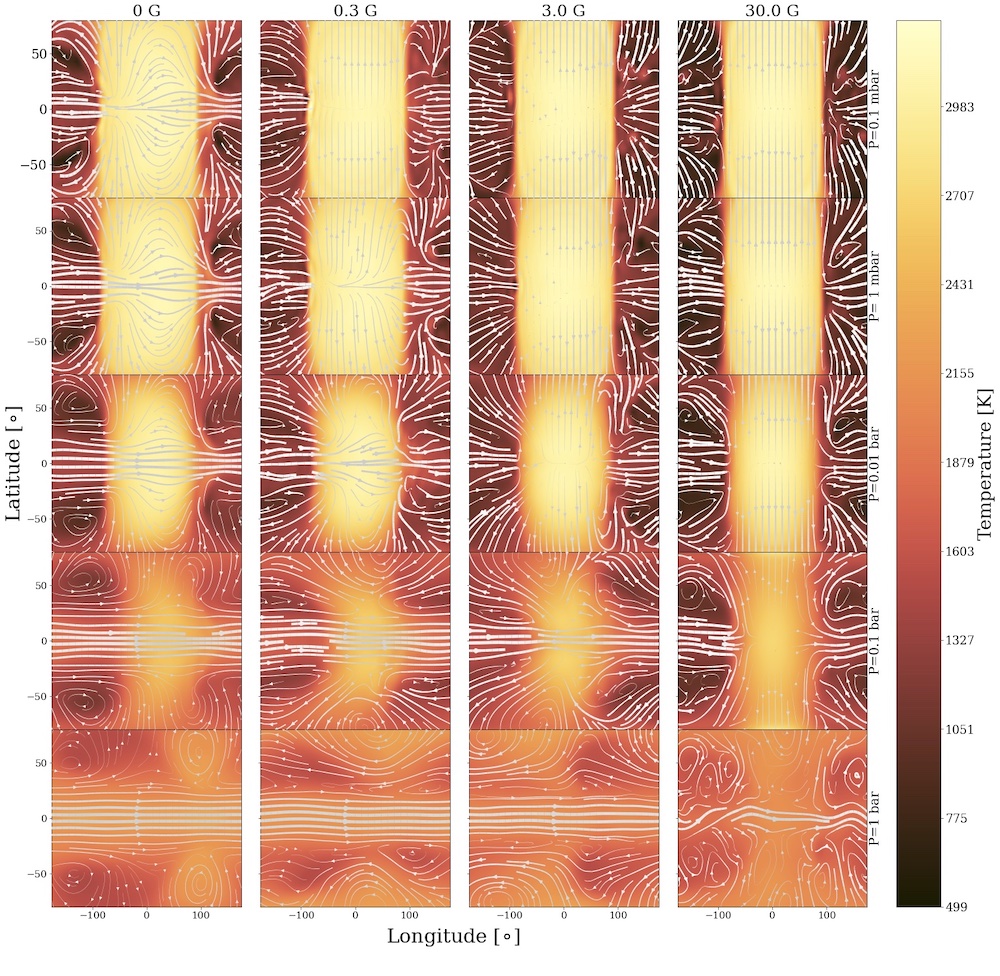
Figure 1: Maps of WASP-76b showing the temperature and wind patterns for the different field strengths at different pressures. Lower pressures, higher in the atmosphere are shown at the top, while higher pressures deeper in the atmosphere are at the bottom. The thickness of the wind arrows demonstrates the speed of the winds. Each map is centred on the dayside of the planet. [Beltz et al. 2022]
The Answer Lies in the Phase Curves
The reduction in the eastward winds in strong magnetic fields means that WASP-76b’s hotpot would have a smaller shift from the sub-stellar point than otherwise expected. The change in wind flow also reduces the amount of heat that moves between the two sides of the planet, increasing the contrast in temperature between the day and night. Helpfully, both of these effects can be tested by observing the planet’s phase curve, which measures the changing brightness of different faces of the planet as it orbits its star.
As shown in Figure 2, the modeled phase curves of WASP-76b have varying amplitudes and peaks at different offsets from an orbital phase of 0.5, when the planet is perfectly behind the star. Stronger magnetic fields cause the phase curve to peak closer to 0.5 due to the lack of hotspot shift. Meanwhile, the phase curve amplitude increases as the reduced winds prevent efficient transport of heat between the day and night sides, increasing the temperature difference and hence the difference in emitted flux.
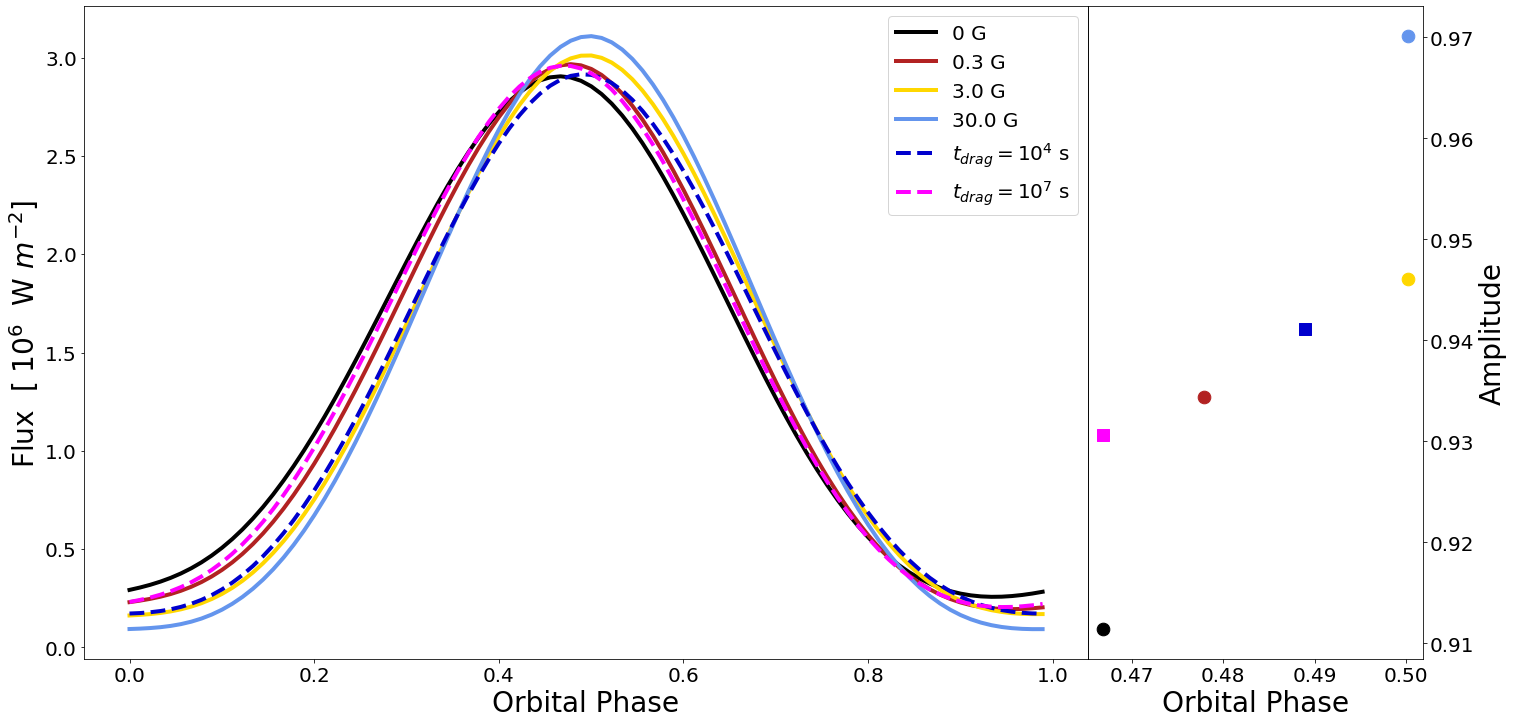
Figure 2: Left: Simulated phase curves of WASP-76b at the four different magnetic field strengths studied in the article (solid lines). To show the difference between the active and uniform drag method, phase curves are also plotted using two different uniform drags, shown with dashed lines. Right: The amplitudes of each phase curve, given by the difference in the maximum and minimum fluxes normalised by the maximum flux. The stronger magnetic fields have phase curves with peaks closer to 0.5 and larger amplitudes. [Beltz et al. 2022]
Despite this, today’s article clearly shows how important it is to consider magnetohydrodynamics when modelling exoplanet atmospheres and provides a great starting point for future studies.
Original astrobite edited by Abygail Waggoner.
About the author, Lili Alderson:
Lili Alderson is a second-year PhD student at the University of Bristol studying exoplanet atmospheres with space-based telescopes. She spent her undergrad at the University of Southampton with a year in research at the Center for Astrophysics | Harvard-Smithsonian. When not thinking about exoplanets, Lili enjoys ballet, film, and baking.