
Stars throughout the galaxy eject ultra-powerful stellar flares, but we enjoy relatively mild solar weather. Studying when and where stellar flares arise may provide the key to figuring out if the Sun is unusually calm compared to other stars like it — or if extreme solar flares are in our future.
Stars Near and Far
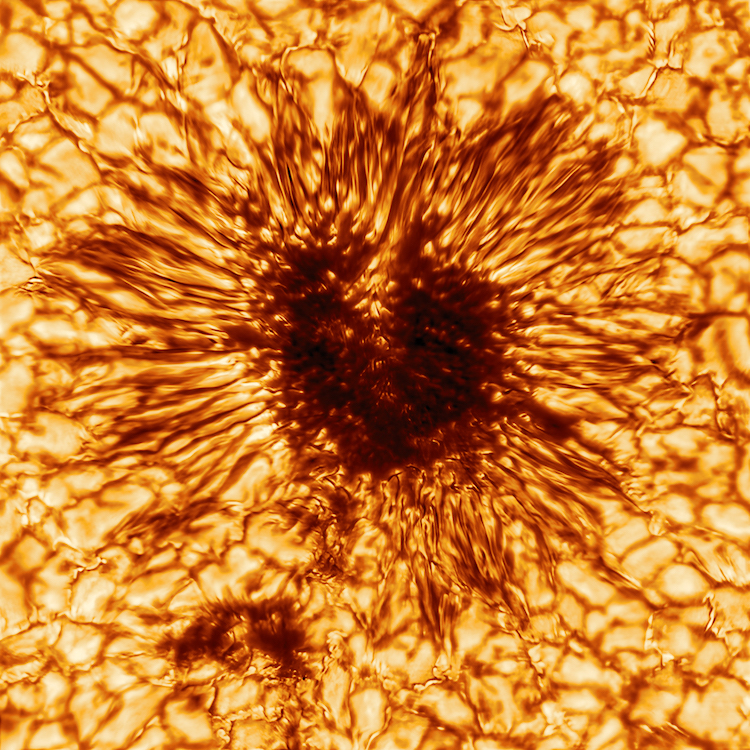
An extreme close-up of a sunspot taken by the Daniel K. Inouye Solar Telescope in Hawai’i. [NSO/AURA/NSF; CC BY 4.0]
How can we study starspots on a star hundreds of light-years away? This is where exoplanets can play an important role: as an exoplanet passes in front of its parent star, it can overlap with a starspot. Because starspots are cooler than the surrounding stellar surface, the star’s light curve will show a small bump when the planet obscures it. By fitting models to the observed variations in the light curve, we can estimate the properties of the occulted starspots — and test whether larger starspots are responsible for more energetic superflares.
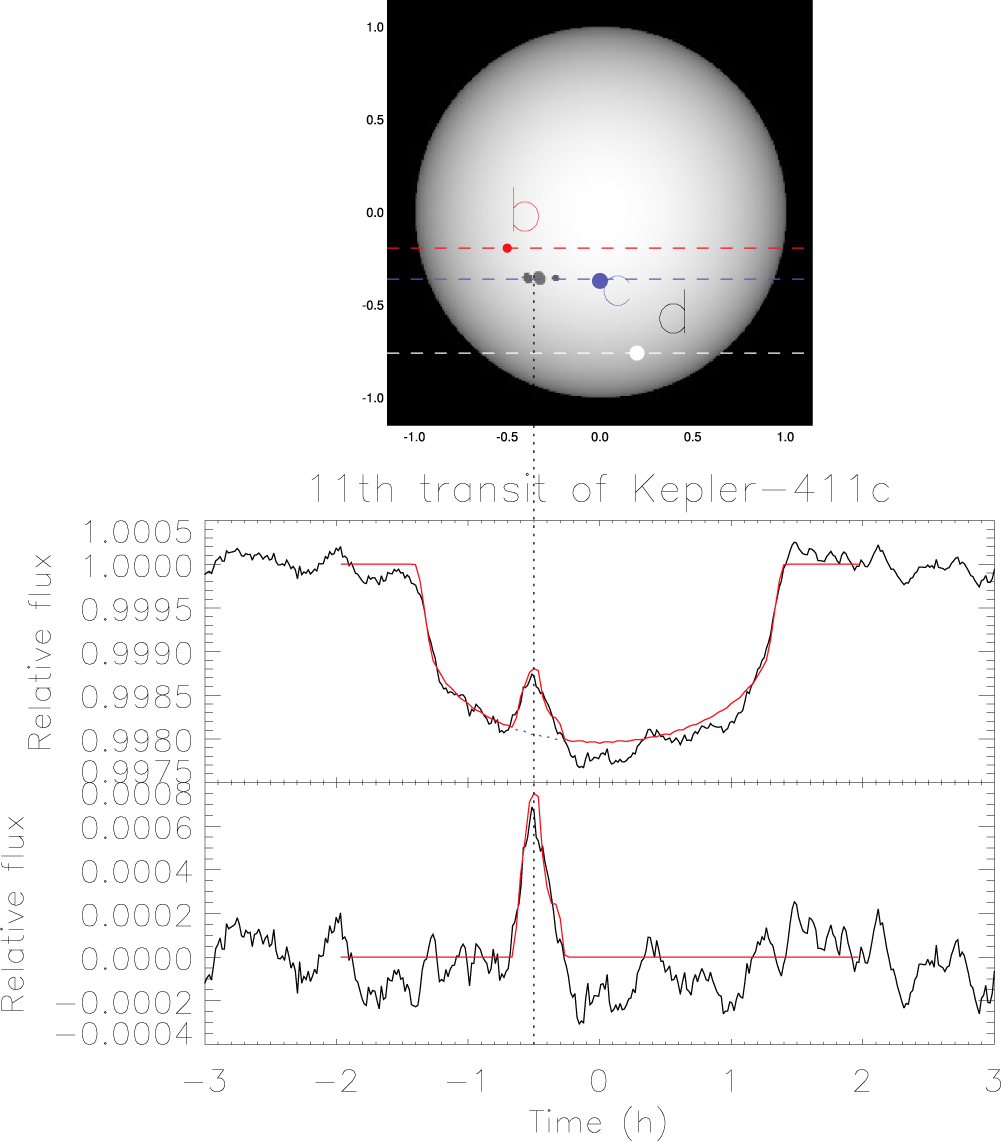
Top panel: Synthesized disk image with Kepler-411’s three planets marked. Bottom panel: Light curve for a sample planetary transit with the best-fitting model in red. The vertical dotted line marks the location of the starspot in the transit light curve. Click to enlarge. [Araújo & Valio 2021a]
Kepler Eyes a Stellar System
Alexandre Araújo and Adriana Valio (Mackenzie Presbyterian University, Brazil) applied this technique to Kepler-411, a slightly smaller and cooler star than the Sun, to understand the connection between its abundant starspots and frequent superflares. Kepler-411 has three confirmed transiting planets — one super-Earth and two mini-Neptunes — which allows for spot detection at the latitudes at which the planets transit: −11°, −21°, and −49°.
During 590 days of Kepler observations, Kepler-411’s three planets collectively made 176 trips across its disk, passing over 198 starspots in total. Araújo and Valio estimated that the starspots averaged 34,000 km in diameter — about the width of Earth, Venus, and Mars placed side by side. The team also spotted 65 superflares in the Kepler light curves, the most energetic of which was about 200 times stronger than the strongest solar flare ever observed.
A Potential Correlation
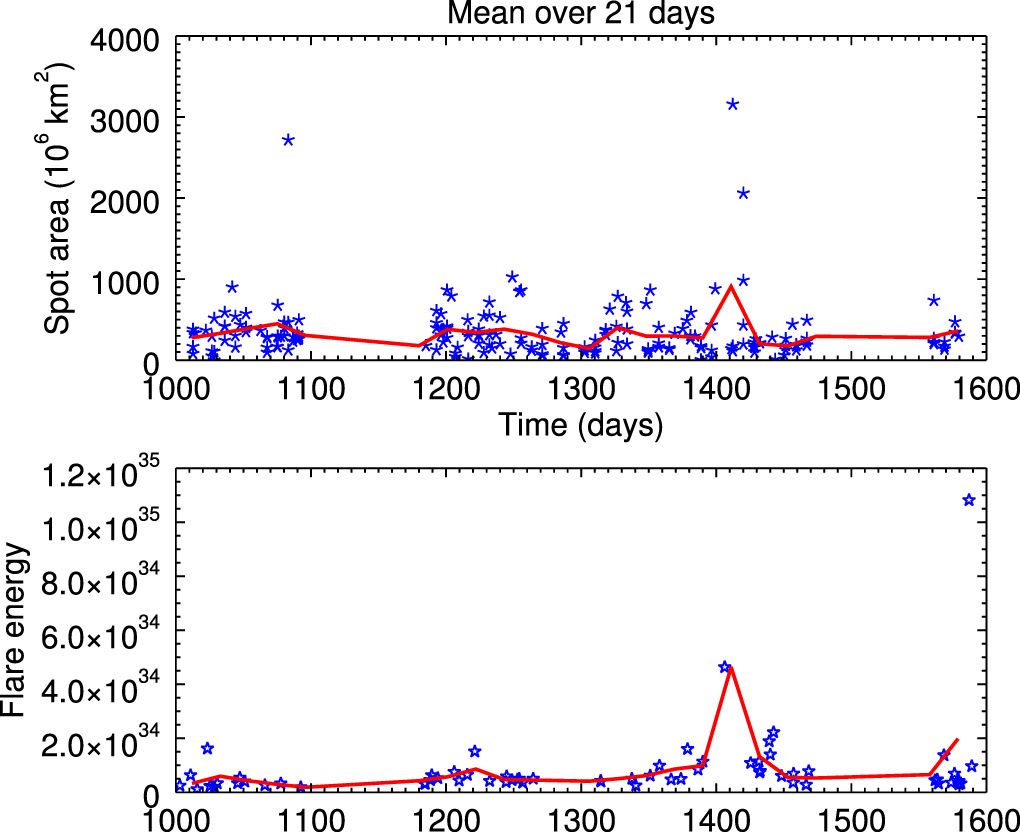
Starspot areas (top panel) and superflare energies (bottom panel) are shown in blue asterisks, with the 21-day running average of each quantity overplotted in red. [Araújo & Valio 2021]
Further work is needed to understand the connection between starspots and superflares, since this technique only allows us to measure starspots at a few latitudes, while flares can arise from any active region on the star. If we’re really lucky, we’ll spy an exoplanet passing in front of a starspot during a flare, which will allow us to pinpoint the flare’s exact location.
Citation
“Kepler-411 Star Activity: Connection between Starspots and Superflares,” Alexandre Araújo and Adriana Valio 2021 ApJL 922 L23. doi:10.3847/2041-8213/ac3767