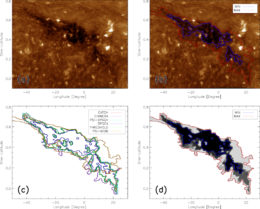
Top left: A 19.3-nanometer image of a coronal hole. Top right: Largest and smallest boundaries of the hole derived by any mapping method. Bottom left: Results of individual mapping methods. Bottom right: Darker areas represent greater agreement between the mapping methods. [Linker et al. 2021]
Coronal holes — named for their dark appearance in X-ray and ultraviolet images of the Sun — are regions where the hot, tenuous solar atmosphere is relatively cool and dense. These areas are thought to be a source of “open” magnetic field lines, a magnetic field configuration that allows solar plasma to escape into the solar system, where it can collide with Earth and other planets. However, astronomers are still working to find effective ways to map these regions, which is key for measuring the amount of open magnetic flux they contain. A team led by Jon Linker (Predictive Science Inc.) tested six mapping methods on images of a large coronal hole taken in 2010, seen in the full image to the right. Linker and collaborators found that these methods tended to produce underestimates of the amount of open magnetic flux compared to measurements made by spacecraft sampling the Sun’s magnetic field in situ, which may partially explain the long-standing deficit in open magnetic flux measured from coronal hole images. Fully understanding the Sun’s magnetic flux may require a mission to image the Sun’s polar regions, which are difficult to photograph from the plane of the solar system. To learn more, check out the full article below.
Citation
“Coronal Hole Detection and Open Magnetic Flux,” Jon A. Linker et al 2021 ApJ 918 21. doi:10.3847/1538-4357/ac090a

