
The presentation of astronomical data in research publications has traditionally taken the form of countless pages of tables and static plots. Today, modern digital publication formats give us alternate options — and one increasingly popular way to present complex data in AAS journals is via interactive figures.
What’s an Interactive Figure?
Gone are the days of nothing but static images! AAS journals now support figures that readers can explore and manipulate, allowing authors to present information in unique ways that overcome the limitations of traditional figures.
While reading a scientific article, have you ever wanted to see data in more than two dimensions? Wished you could pull numbers directly from a plot? Or rescale axes to your preferred units? Or fly through zoomable data, view it from different angles, and focus in on different regions?
With interactive figures, you can do all this and more.
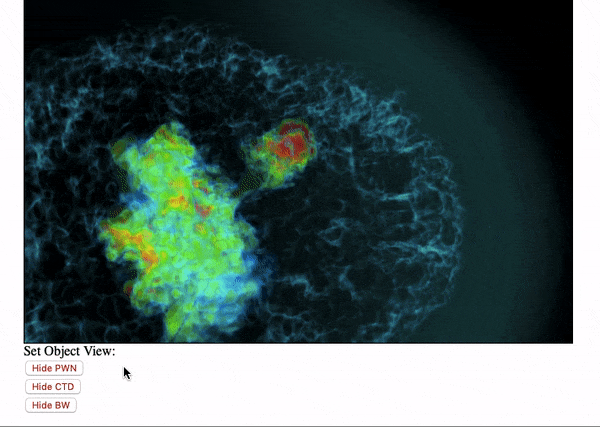
GIF of an interaction with an image describing a supernova remnant model from Kolb et al. 2017.
Exploring an Interactive Figure
Ready to check one out for yourself?
Click here to visit an example of an interactive figure.
The link above will take you to a set of X-ray light curves for a recurrent nova, published in an RNAAS article led by AAS data editor Greg Schwarz. The interactive figure initially appears as a placeholder image — this is the still version that will appear in the PDF form of the article. At the bottom of the figure caption, you’ll see a button that reads “Start Interaction”. Click that to begin!
Once the interactive figure is turned on, you should be able to zoom in and out of the data by scrolling with your mouse or trackpad (or pinch to zoom on mobile interface), and you can hover over individual data points to see precise values. If you click the “hamburger” menu button located at the top right of the image, you’ll see additional options allowing you to turn data sets on and off, rescale the axes, and download both the figure and the data behind it.
This example is just one type of interactive figure; you can view more and get a sense of what other capabilities are possible on the Astronomy Image Explorer.
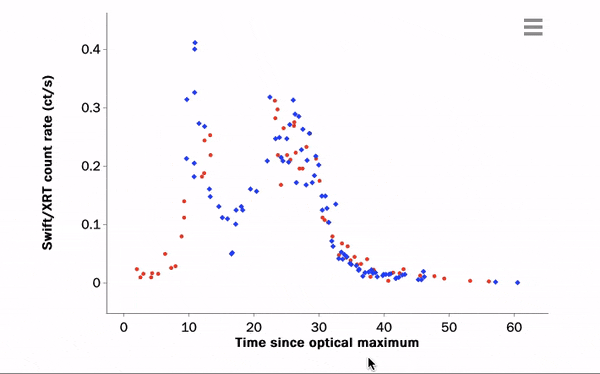
GIF of an interaction with a light curve from Schwarz et al. 2020.
Making an Interactive Figure
Are you sold on the value of interactive figures, but not sure how to make one yourself for inclusion in your next AAS journal article? We’re here to help!
At its core, an interactive figure is a piece of HTML code. This code can be a complex web application, but it doesn’t have to be — the simplest interactive figures can be produced in just a few minutes with the tools provided by the community. A couple resources:
- Want to start simple? You can take your FITS files and place them in the context of the rest of the sky in a live image with this straightforward cloud-based Jupyter notebook. No installation necessary!
- Ready to dig in deeper with a look at data that have a time component? The AAS Light Curve Tool user manual will walk you through how to read in and manipulate time series data in Astropy and produce interactive figures.
The journals of the AAS all support inclusion of interactive figures.
Once you’ve made an interactive figure, the next step (we hope!) is to include it in your AAS journal manuscript. Along with the HTML that forms the basis of your interactive figure, you’ll also include a static image version and a written caption that summarize the ideas that it conveys. These additions are important to make sure that your figure is accessible to people who are unable to fully experience the interactive format, like people with visual impairments, difficulties with fine motor control, or low-bandwidth internet connections.
To learn more about how to incorporate your interactive figure into an AAS journal manuscript, you can consult the following basic information about support for interactive figures in AAS journals. Specific instructions for adding interactive figures to your LaTeX article manuscripts can be found in the AASTeX 6.3 Author Guide.
Looking to the Future
Hopefully you’re now convinced that interactive figures can help authors more effectively tell a story with their data. Please feel free to contact us with questions or comments. In the meantime, we’re looking forward to seeing more of these in upcoming AAS journal articles as the community continues to innovate and push beyond the limitations of printed research articles!
1 Comment
Pingback: AAS Publishing News: An Interview with the AAS Journals Data Editors