
Astronomers have drawn detailed maps of dark spots on the Sun’s surface since Galileo’s time. Today, we have a host of modern spacecraft that make these observations for us, continuously charting the shifts in sunspot patterns and solar magnetic fields. Can computers help us to bridge between these historical and modern datasets?
A Long-Lived Record
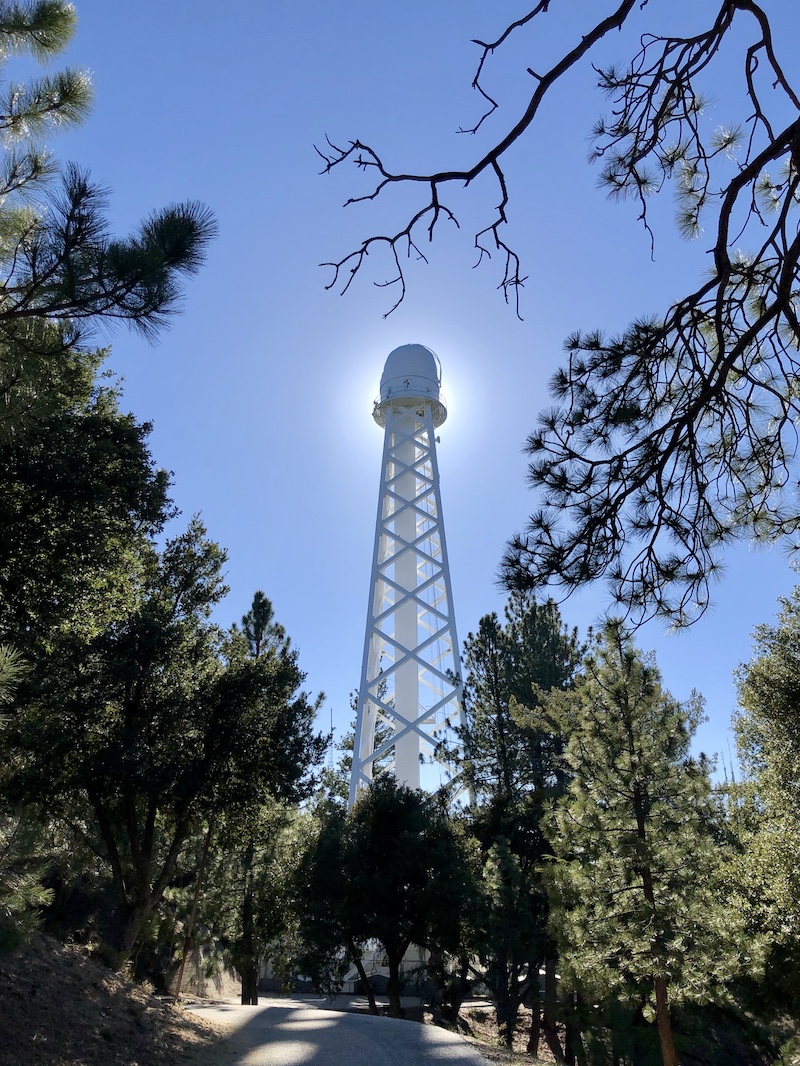
Photograph of the 150-ft solar tower at Mt. Wilson Observatory, where daily sunspot drawings have been produced since 1912. [Susanna Kohler]
Historical sunspot records have provided valuable insight into the behavior of our nearest star. But today, we can also gather more sophisticated solar data. Space-based telescopes like the Solar Dynamics Observatory (SDO) monitor the Sun’s emission at a variety of wavelengths and produce magnetograms that reveal the magnetic field arrangements across the Sun’s surface. These modern observations allow us to explore the Sun’s magnetic flux and the light emitted from solar active regions — information that can tell us more about how the Sun’s activity evolves and how it impacts the Earth.
What if we could gain this same level of insight from historical daily sunspot drawings? Led by Harim Lee, a team of scientists from Kyung Hee University in the Republic of Korea has undertaken the challenge of translating sunspot drawings into something that more closely resembles modern satellite data.
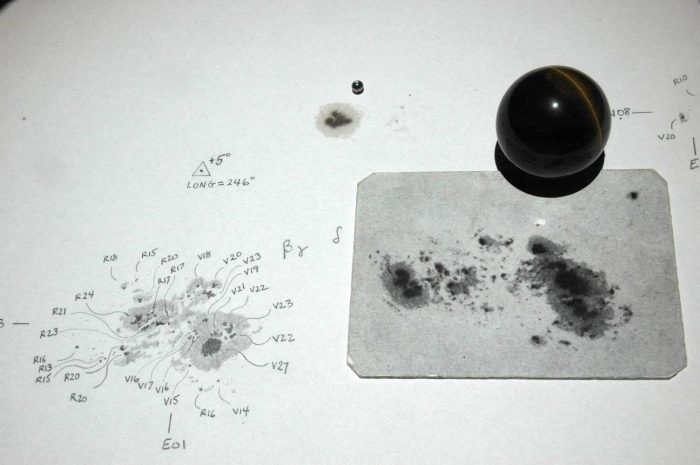
Photograph of a sunspot drawing produced at the Mt. Wilson Observatory. [Mt. Wilson Observatory]
Teaching a Computer to Translate Drawings
Lee and collaborators recognized that the 100+ years of daily sunspot drawings from Mt. Wilson Observatory have a significant benefit: there is overlap between these drawings and modern satellite data. The authors compiled a set of more than a thousand Mt. Wilson sunspot drawings from 2011 to 2015 that they then paired with the corresponding daily ultraviolet/extreme ultraviolet (UV/EUV) images and magnetograms captured with SDO.
The next step: train a computer to map between the datasets. Using a training set of 1,046 pairs of sunspot drawings and SDO images, Lee and collaborators developed a deep learning model that takes a sunspot drawing as input, and generates a magnetogram and a set of seven mock SDO images at different UV/EUV wavelengths as output.
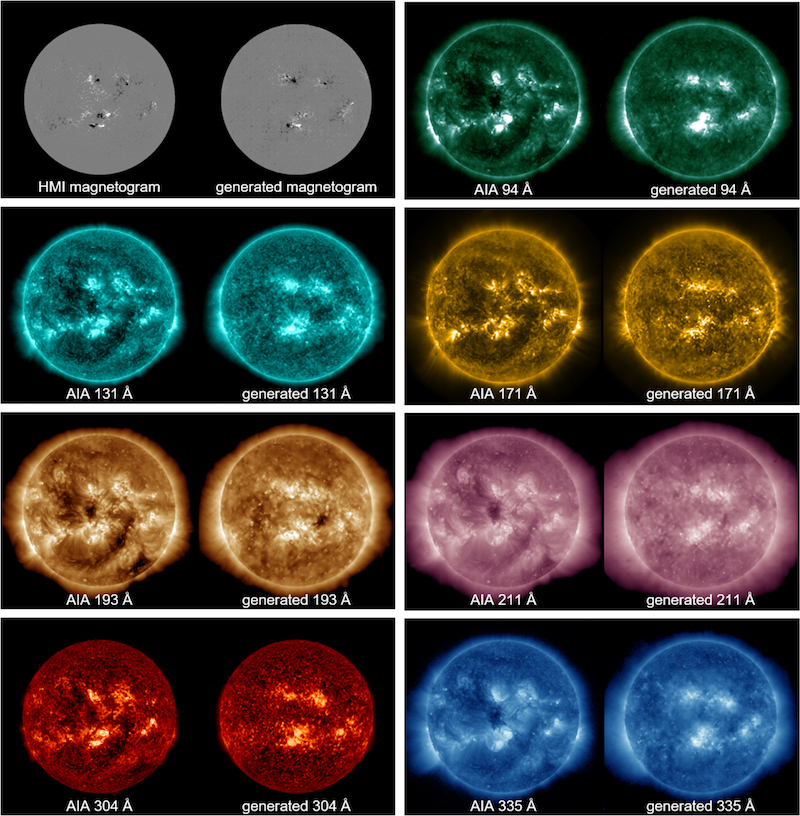
Comparison between real SDO images (left image of each pair) and the model-generated ones (right image of each pair) for sunspot observations on 8 June, 2014. Click to enlarge. [Lee et al. 2021]
Finally, Lee and collaborators apply their model to Galileo’s original sunspot drawings from 1612, generating mock SDO images and magnetograms for a time more than four centuries ago.
The authors note that this unique method of modernizing historical data is, of course, limited in what it can reproduce — but it does provide us with unusual insight into the long-term evolution of our Sun’s magnetic fields and radiation.
Citation
“Generation of Modern Satellite Data from Galileo Sunspot Drawings in 1612 by Deep Learning,” Harim Lee et al 2021 ApJ 907 118. doi:10.3847/1538-4357/abce5f