
Editor’s note: Astrobites is a graduate-student-run organization that digests astrophysical literature for undergraduate students. As part of the partnership between the AAS and astrobites, we occasionally repost astrobites content here at AAS Nova. We hope you enjoy this post from astrobites; the original can be viewed at astrobites.org.
Title: Testing the Isotropy of the Dark Energy Survey’s Extreme Trans-Neptunian Objects
Authors: Pedro H. Bernardinelli, Gary M. Berstein, Masao Sako et. al
First Author’s Institution: University of Pennsylvania
Status: Submitted to The Planetary Science Journal (PSJ)
Out beyond the orbit of Neptune lie small solar system bodies called trans-Neptunian Objects (TNOs). They are rocky, icy, dirt balls that lie far beyond Neptune for the majority of their orbits, but their perihelia exist within the orbit of Neptune, or less than about 30 AU.
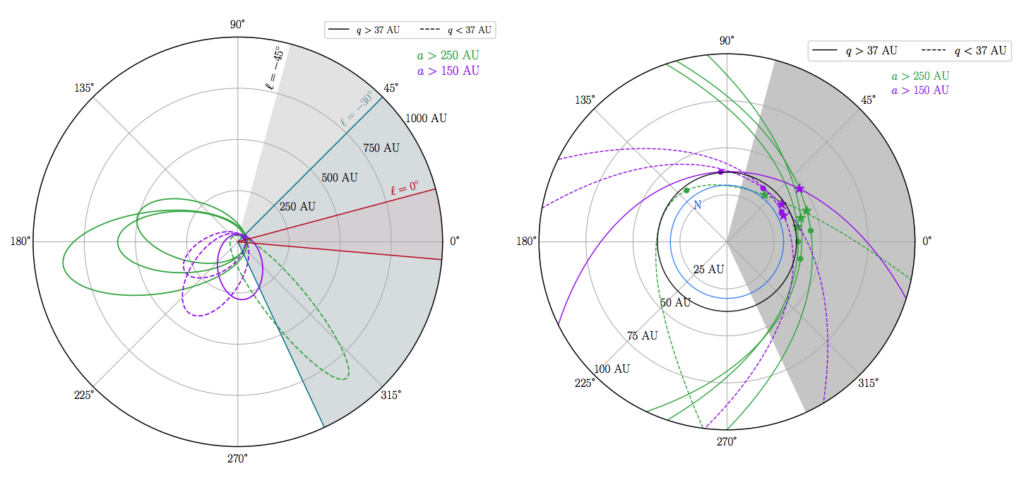
Figure 1: The orbits of the seven trans-Neptunian objects discovered in the Dark Energy Survey. These are polar plots, so it’s similar to what we would see if we looked at the orbits of these objects from a (space)bird’s-eye view. The figure on the left shows the full extent of their orbits; green orbits have an aphelion (their furthest extent) greater than 250 AU, purple orbits have an aphelion between 150 and 250 AU. The dashed lines have a perihelion (closest approach to the Sun) less than 37 AU (so they get pretty close to Neptune), and the solid lines have a perihelion greater than 37 AU (so they are not strongly affected by Neptune’s gravity). The figure on the right is a zoom-in showing their perihelia compared to Neptune’s orbit in blue. [Bernardinelli et al. 2020]
Finding Anti-Symmetric Orbits
This paper uses data from the Dark Energy Survey (DES), which, while on the quest for dark energy signatures far beyond our solar system, has found some extreme trans-Neptunian objects (eTNOs, basically very distant TNOs). Based on the observed TNOs from DES, we can see that their orbits appear to be aligned. As you can see in Figure 1, they appear to lie on one side of the sky, having similar ecliptic longitudes. That’s weird, because things in space tend to be symmetrically distributed, or isotropic. So, shortly after astronomers saw these weirdly aligned orbits, an interesting hypothesis came about. Maybe there is a super-Earth located way beyond the orbit of Neptune that is pushing these TNOs onto these aligned orbits. That hypothesized planet was nicknamed Planet 9 and is still being hunted for after about 4 years of searching.
But What If We Just Aren’t Looking Hard Enough?
Before we hype up this underdog of a planet, we must ask ourselves, is Planet 9 really the most likely explanation for the TNO clustering? We have not observed the full TNO population. What if that population is actually isotropic, and we are just looking at a few members of that population that happen to be on one side of the sky? This is the question that today’s paper poses. Given how we observed these objects, and where we’ve pointed our telescopes, could the observed TNOs be just one part of an isotropic population? If so, then Planet 9 doesn’t need to exist.
This paper starts to explore that question by creating a simulated population of 40 million TNOs that are defined by certain orbital parameters. The longitude of the ascending node (ᘯ), argument of perihelion (⍵), and mean anomaly (M, which is approximately the angular distance of object from its pericenter), are all given random values, i.e., they are distributed isotropically, so there is no preferred value. The eccentricity, inclination, and aphelion are kept within certain values taken from the seven observed TNOs from the Dark Energy Survey.

Figure 2: Schematic showing the different orbital parameters used to characterize TNOs in this study. This study created a simulated population of TNOs that had ᘯ, ⍵, and the mean anomaly distributed randomly, but kept orbital parameters such as inclination, eccentricity, and aphelion consistent with observed TNOs. [Arpad Horvath]

Figure 3: Histograms showing the highest likelihood values for three orbital parameters that describe TNOs. There were four different eTNO cases explored based on differing definitions of what an eTNO is. The green and purple lines are the eTNOs that the Dark Energy Survey has discovered. [Bernardinelli et al. 2020]
This study ran two statistical tests to compare the two samples: Kuiper’s test and a likelihood test. From Kuiper’s test, they calculate a p-value; a higher p-value means that the two populations are similar. They run the test to compare the ᘯ, ⍵, and ᘯ + ⍵ values found in the simulated population to that which was observed. In the likelihood test, they compare the observed orbital angles for each sample to produce an f-value, which can be converted to a % likelihood. A low percent means that it is very unlikely that the observed sample comes from an isotropic population and a high percent means that it is very likely.
They also had four different observed samples, each of which is a subset of the 7 observed eTNOs, and each case was motivated by a different definition what an eTNO is. Each case appears to be aligned to some degree. Case 1 – 4 went from lenient definitions to strict definitions describing eTNOs. Case 1 included all seven TNO objects, while Case 4 only included those that had an aphelion beyond 250 AU and a perihelion greater than 37 AU — which includes only three objects that appear to be strongly aligned. The most extreme TNOs are going to be least affected by Neptune, and most affected by Planet 9, if it exists.
They then ran their statistical tests on these four cases. They found that when they include all seven eTNOs, it agrees well with coming from an isotropic population — which means that Planet 9 is not necessary to explain the TNO orbits. When they go down to the most strict definition of eTNOs, the p-values tend to drop. This means it becomes less likely the eTNOs that we see come from an isotropic population, however the p-values are not low enough to completely rule that out.
So Are the Authors Trying To Kill Planet 9?
In the end, this paper was able to recreate the orbits of known TNOs using an isotropically distributed TNO population. This means that Planet 9 doesn’t need to exist. However, their results change when they run the same statistical test against 3 out of the 7 TNOs. In this case, it’s harder to show that these orbits come from a randomly distributed population, leaving some hope for the Planet 9 enthusiasts. When working with such a small sample size (seven objects!) it’s hard to come to a confident conclusion. The authors look forward to more years of DES so that more eTNOs can be discovered, improving our understanding of TNOs and the mysterious Planet 9.
About the author, Jenny Calahan:
Hi! I am a second year graduate student at the University of Michigan. I study protoplanetary disk environments and astrochemistry, which set the stage for planet formation. Outside of astronomy, I love to sing (I’m a soprano I), I enjoy crafting, and I love to travel and explore new places. Check out my website: https://sites.google.com/umich.edu/jcalahan