
Editor’s note: Astrobites is a graduate-student-run organization that digests astrophysical literature for undergraduate students. As part of the partnership between the AAS and astrobites, we occasionally repost astrobites content here at AAS Nova. We hope you enjoy this post from astrobites; the original can be viewed at astrobites.org.
Title: Measuring Star-Formation Histories, Distances, and Metallicities with Pixel Color-Magnitude Diagrams I: Model Definition and Mock Tests
Author: B. A. Cook, Charlie Conroy, Pieter van Dokkum, & Joshua S. Speagle
First Author’s Institution: Harvard-Smithosonian Center for Astrophysics
Status: Submitted to ApJ
The wealth of information we have gathered about the lives of galaxies within our universe is due in part to increasingly larger and more sophisticated surveys of the night sky. Better resolution, precipitated by rapid advancement in imaging technology and telescope design, has enabled detailed studies ranging from our local group to the edges of the cosmos.
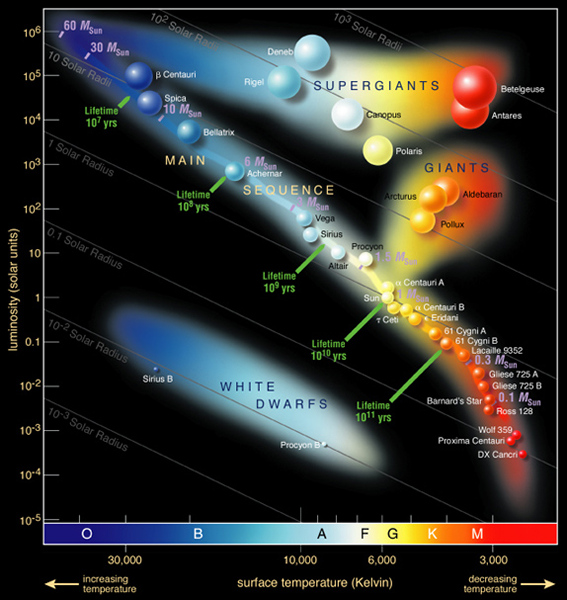
Figure 1: Example stars plotted on a color–magnitude diagram. [ESO]
While many of these techniques have been known and readily applied in the past and met with great success within our Galaxy, the authors of today’s astrobite demonstrate that this old dog can be taught new tricks.
The Usefulness of Barely Resolved Galaxies
Our ability to understand the universe is limited in part by angular resolution. For the few galaxies in the nearby universe for which individual stars can be discerned, we can rely on traditional techniques to understand their stellar populations, dust, and metal content in exquisite detail. The opposite is true for extremely distant galaxies, captured in only a handful of pixels with no hope of resolving any stars whatsoever. In this latter regime, we must rely on difficult-to-calibrate theoretical models of galaxy spectra to estimate the integrated properties of these remote systems.
In between these two extremes lie the semi-resolved galaxies, and they exhibit an interesting observational quirk. Although individual stars cannot be resolved, there are enough pixels such that, for any one pixel, there may be surface brightness fluctuations caused by rare but bright stars. The fluctuations trace the number of bright stars visible due to Poisson sampling and have been exploited in the past. The authors of this paper go further by leveraging these surface brightness fluctuations to construct a pixelized analog of a color–magnitude diagram for a semi-resolved system, termed a pixelized CMD (pCMD). The traditional diagnostics to estimate star, dust, and metal content are hence accessible, albeit with more complex implementation.

Figure 2: Summary of the pCMD method. A) Metallicity and a star-formation history model dictate the stellar evolution tracks. B) Stars are randomly sampled per pixel. C) Stars are modified for dust and distance. D) The simulated image is made by summing the fluxes of all the stars drawn into that pixel, as shown in the top left corner. E) The models are convolved with models of the instrument response. F) Pixel fluxes are converted to apparent magnitude, with the original stellar evolution track shown beneath for reference. [Cook et al. 2019]
The Pixelized Color-Magnitude Diagram
The pCMD contains information not only about the galaxy, but also effects relating to the instrumentation — including the point-spread function (PSF) and photometric noise — that must be accounted for. The authors opt for a forward modeling approach: from a model of stellar photometry and knowledge of the instrument, they construct a simulated pCMD and compare it to observations, as described in Figure 2. By constructing a grid of simulated pCMDs varying in stellar content, dust, and metallicity, the authors can then determine the best-fit parameters by searching through the grid of models to find the closest match.
In the current implementation of the pCMD method (PCMDPy — available on GitHub), there are four components of the model inherent to the galaxy:
- Stellar populations: The current stellar populations observed are the direct result of star formation dating back to the formation of that galaxy. They should trace the assembly of stellar mass over time — known as the star-formation history (SFH) — and vice versa. Hence, the distribution of stellar masses formed (the inital mass function, or IMF) will govern not only the distribution of stellar masses, but also the conversion between the number of stars and the mass of stars within a pixel. Having confident estimates the SFH of a galaxy can enable definitive studies of the assembly of galaxies in the universe, which is currently a major line of research.
- Metallicity: The metallicity of each pixel is modeled independently of the star-formation history in the current implementation. This is a simplification, as interstellar metallicity is driven by enrichment from dying stars and supernovae.
- Dust: Dust will have the effect of both reddening and dimming the light from a galaxy. In this implementation, the dust is modeled as a single thin screen per pixel. Although this, too, is a simplification, it is necessary, as dust geometries are virtually impossible to obtain.
- Distance: As a given galaxy is seen at larger distances, the number of stars per pixel increases. Although the surface brightness remains constant, the rare Poisson fluctuations due to particularly bright stars decreases and the average luminosity per pixel increases. As shown in Figure 3, this increases the overall brightness level in the pCMD but decreases the scatter. Hence, pCMDs can simultaneously recover distances and stellar populations for galaxies in the semi-resolved regime.

Figure 3. Effect of surface number density and distance, where each row has the same average flux. Increasing the surface number density Npix raises the CMD and decreases the scatter due to fewer fluctuations, but it does not change its color. Changing distance has a similar effect, but it does not affect the scatter. [Cook et al. 2019]
About the author, John Weaver:
I am a first year PhD student at the Cosmic Dawn Center at the University of Copenhagen, where I study the formation and evolution of galaxies across cosmic time with incredibly deep observations in the optical and infrared. I got my start at a little planetarium, and I’ve been doing lots of public outreach and citizen science ever since.