
Editor’s note: Astrobites is a graduate-student-run organization that digests astrophysical literature for undergraduate students. As part of the partnership between the AAS and astrobites, we occasionally repost astrobites content here at AAS Nova. We hope you enjoy this post from astrobites; the original can be viewed at astrobites.org.
Title: A HOT SATURN ORBITING AN OSCILLATING LATE SUBGIANT DISCOVERED BY TESS
Author: Daniel Huber, William J Chaplin et al.
First Author’s Institution: Institute for Astronomy, University of Hawai’i
Status: Submitted to AAS Journals
NASA’s space mission TESS is currently hunting for new exoplanets in the southern hemisphere sky. But while its primary aim is to find 50 small (radii less than 4 Earth radii) planets with measurable mass, there is a lot of other interesting science to do. Today’s paper presents the discovery of a new exoplanet that is quite precisely characterised thanks to the complementary technique of asteroseismology used on the same data.
Meet TESS
TESS will survey stars over the entire sky, studying 26 strips for 27 days each. Data for selected bright stars is downloaded to provide data points every 2 minutes (i.e., a 2-minute cadence) and then processed through a pipeline to produce light curves. Another pipeline detects transit-like signals in these lightcurves — and it recently identified TOI-197.01 as a planet candidate (see Figure 1a).
Is It an Exoplanet?
The authors used high-resolution imaging by the NIRC2 camera on the Keck telescope to rule out companion stars that could produce a similar light curve. An intense spectral monitoring campaign of 111 spectra from 5 different instruments in a seven-week period let them search for periodic Doppler shifts in the stellar spectrum caused by the mass of another object tugging on the star. The mass they calculated from these radial velocities (seen in Figure 3) confirmed that TOI-197.01 is an exoplanet.
Stellar Pulsations
Photometry from space is not only useful for finding exoplanets: Kepler could detect the periodic changes in stellar brightness caused by stellar pulsations or ‘star quakes’. Asteroseismology, the study of these pulsations, allows astronomers to investigate the inner structure of bright stars and calculate their key properties, including radius and mean density, very precisely. Astronomers expected they could also study stellar pulsations using TESS data.
After removing the transit signal from the TESS light curves (giving Figure 1b), the light curve is Fourier transformed from time (days) into frequency (µHz), giving the power spectrum seen in Figure 1c. Modeling the stellar pulsations along with the stellar granulation and white noise (see Figure 1c), the authors then ‘smoothed’ the power spectrum to identify the location of the tallest peak, i.e. the frequency of maximum power at 430 µHz, and its height, or power.
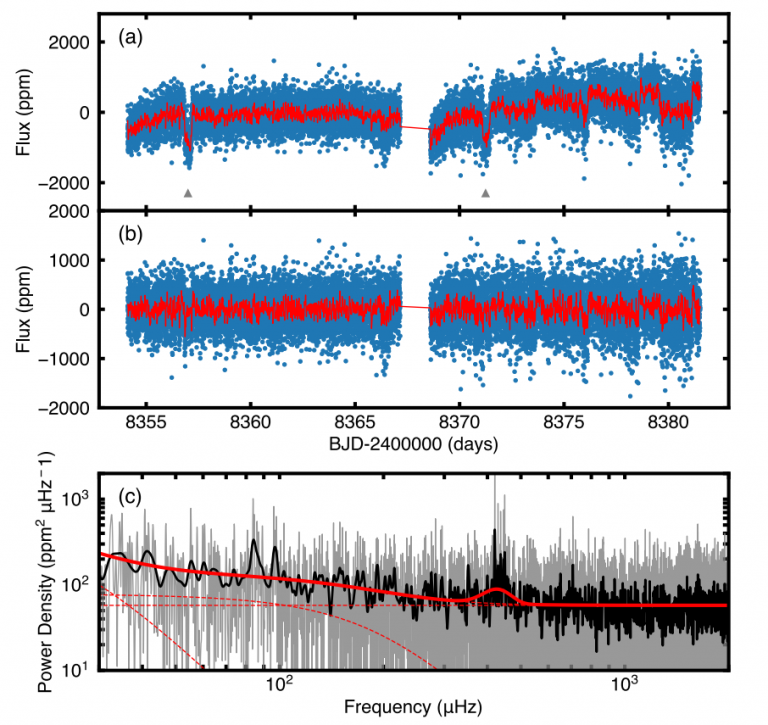
Figure 1: The TESS lightcurve of TOI-197. a) Raw TESS lightcurve showing two transits marked by grey triangles. b) Corrected TESS lightcurve with transits and instrumental effects removed. c) Power spectrum of the corrected lightcurve, where dashed red lines show the granulation and white noise. The solid red line is a fit to these as well as the stellar pulsations. [Huber et al. 2019]
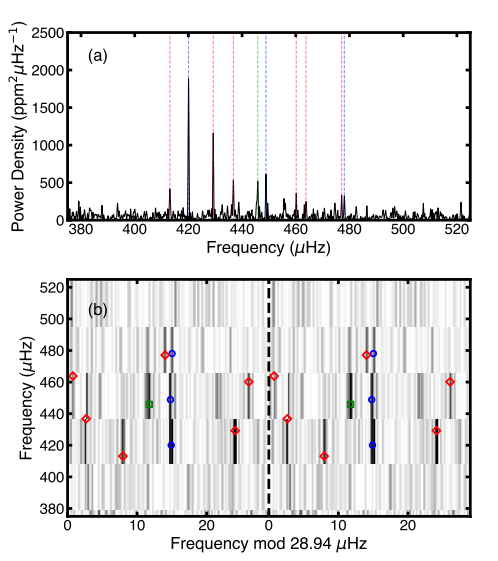
Figure 2: a) Power spectrum of TOI-197.01 in the region of frequency space showing oscillations. Vertical lines mark identified individual frequencies, with blue showing the radial modes. b) Blue circles represent the radial modes that line up vertically when the difference between them is 28.94 µHz, illustrating the large frequency separation. Figure repeats in the x axis about 0. [Huber et al. 2019]
Modeling Stellar Properties
The authors then used stellar-evolution and oscillation codes to model the stellar properties. The luminosities for the model were calculated by combining the Gaia parallax with photometry from many different catalogues. They also input properties they modeled from the spectra — temperature, surface gravity (log g), and metallicity — and combined them with the individual frequencies and large frequency separation from asteroseismology. This resulted in two preferred models: i) a lower mass, older star (1.15 solar masses, ~6 Gyr old) or ii) a higher mass, younger star (1.3 solar masses, ~ 4 Gyr old). An independent constraint on surface gravity from an autocorrelation analysis of the light curve favours a higher mass model. Thanks to asteroseismology, the final estimates of stellar parameters have small uncertainties: radius (2%), mass (6%), mean density (1%), and age (22%).
Characterising the Planet
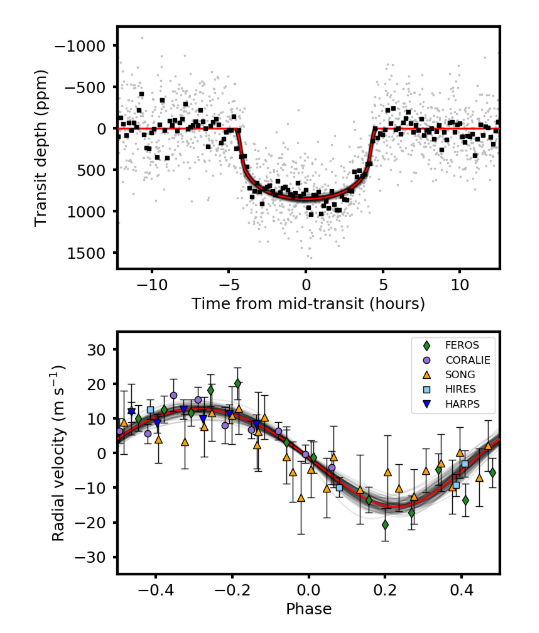
Figure 3: Data for TOI-197 folded on the best period of 14.3 days. Top: the TESS lightcurve. Bottom: radial velocity curve. [Huber et al. 2019]
A Hot Saturn and a Bright Future!
The result is TOI-197.01 is a hot Saturn orbiting a late subgiant/early red giant star. The combination of spectra and the large frequency separation from asteroseismology shows the star has just started ascending the red giant branch. TOI-197.01 represents the starting point before gas giants reinflate due to the strong flux from their evolved stars. TOI-197.01 is significant as the first transiting planet orbiting a late subgiant/early red giant with detected oscillations measured by TESS, and only the 6th ever discovered (with the others found by Kepler). Indeed, fewer than 15 transiting planets are known around red giants in total.
This is an exciting result as it shows that even with only 27 days of data, TESS should allow us to study the oscillations of thousands of bright stars in the 2-minute cadence data. TOI-197.01 is also one of the most precisely characterised Saturn-sized planets, with density constrained to 15%, demonstrating what we can gain when we can ‘listen’ to exoplanet host stars.
About the author, Emma Foxell:
I am a PhD student at the University of Warwick. My project involves searching for transiting exoplanets around bright stars using telescopes on the ground. Outside of astronomy, I enjoy rock climbing and hiking.
1 Comment
Pingback:AAS Nova – New