Editor’s note: Astrobites is a graduate-student-run organization that digests astrophysical literature for undergraduate students. As part of the partnership between the AAS and astrobites, we occasionally repost astrobites content here at AAS Nova. We hope you enjoy this post from astrobites; the original can be viewed at astrobites.org!
Title: The Transit Light Source Effect: False Spectral Features and Incorrect Densities for M-Dwarf Transiting Planets
Author: Benjamin V. Rackham, Dániel Apai, and Mark S. Giampapa
First Author’s Institution: The University of Arizona
Status: Published in ApJ
Twice in my life, I have mistakenly purchased green sweaters. “What a lovely pearl gray!” I have thought in the soothing, dim light of a Target fitting room. “This will go so nicely with my red corduroys,” I have mused under the bland fluorescent bulbs of the check-out line. “Dammit, green again?” I have sworn in the harsh sunshine of the parking lot.
Unhappily, this is neither the most important nor the most expensive mistake an astronomer can make about lighting. Misinterpreting the color of a sweater based on the wrong perception of the ambient light? Not so bad — I just had to wait in another line to return the impostor sweater. But misinterpreting the color of planets based on misunderstanding their host stars’ light? Today’s authors warn that such a mistake could lead us to false conclusions about planetary atmospheres, compositions, and habitability.
The Wrong Kind of Light
Planets are cool (temperature-wise, but also in terms of social status), and therefore planets are dim. All of our knowledge of planets beyond our solar system is therefore somewhat indirect; it comes from analyzing the much brighter light from a planet’s host star, influenced by the planet in some way. In the most straightforward case, a big planet reflects some starlight, and we take a picture of it. Subtler planets block some starlight, or swing the star around at such speeds that the starlight changes color.
Planets with atmospheres are able to warp starlight in another way: while the body of the planet blocks a big chunk of starlight as it crosses in front of its host star, the planet’s thin, enveloping atmosphere absorbs starlight at particular colors, or wavelengths.
We can subtract a spectrum of the star taken before the planet crosses the star from a spectrum taken right in the middle of its transit — the difference, called a “transmission spectrum,” is the signature of the planet’s atmosphere. Different molecules have different spectral effects, so the transmission spectrum tells us what the planet’s atmosphere is made of.
But how do we know what out-of-transit spectrum to subtract? Usually, we take the average spectrum of the whole star. But as today’s authors remind us, stars are fickle and inconstant creatures. Their surfaces change; dark starspots bubble and bright faculae simmer.
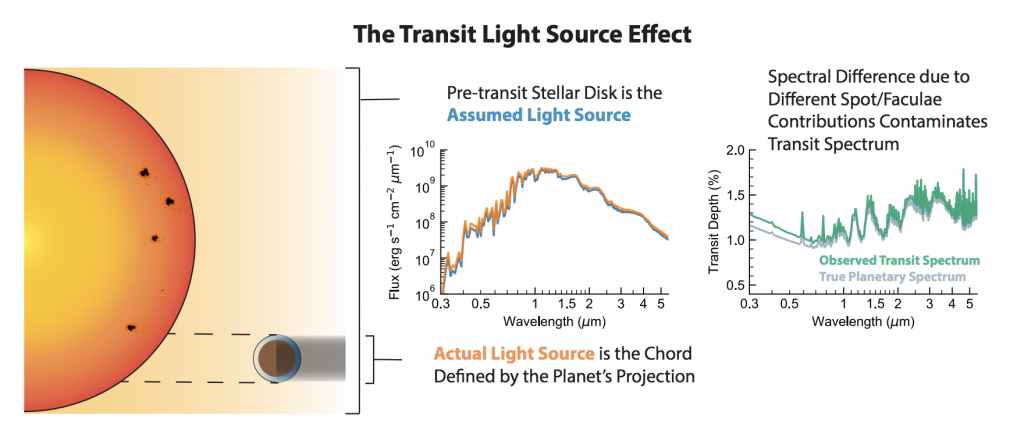
If a planet transits directly across one of these features, it’s back-lit by a different light than the average light of the star. Subtracting the average, in this case, imparts a false signal in the transmission spectrum (see Figure 1). Just as I mistook a green sweater for gray by mistaking yellowish indoor light for white, we may end up interpreting planet spectra wrongly by misunderstanding the spectral colors of their host stars.

Figure 1. An illustration of the “transit light source effect,” by which we can derive an incorrect understanding of a transiting planet’s atmosphere by wrongly assuming that the planet transits an “average” piece of the star. Middle panel: The spectrum of the entire star, averaged together (blue) vs. the spectrum of the piece of star that the planet actually crosses (orange). Right panel: As the planet transits, its atmosphere absorbs some of the starlight it intercepts. By subtracting an in-transit spectrum from an out-of-transit spectrum, you can isolate the spectral signature of the planet’s atmosphere. But if you subtract the (wrong) blue spectrum instead of the (right) orange one, you get the wrong atmospheric signal (green) instead of the right one (gray). [Rackham et al. 2018]
The Wrong Answers
An incorrect transmission spectrum is a dangerous thing. Not only can it lead us astray with respect to the chemical makeup of the planet’s atmosphere, it can also lead us to wrong answers about much more basic properties, like the planet’s size.
Alarmingly, it’s difficult to estimate how spotted any particular star is — and therefore how wrong we’re likely to be — based on a transit observation alone. The authors focus on M-dwarf stars, whose surfaces are poorly understood and which commonly host rocky exoplanets.
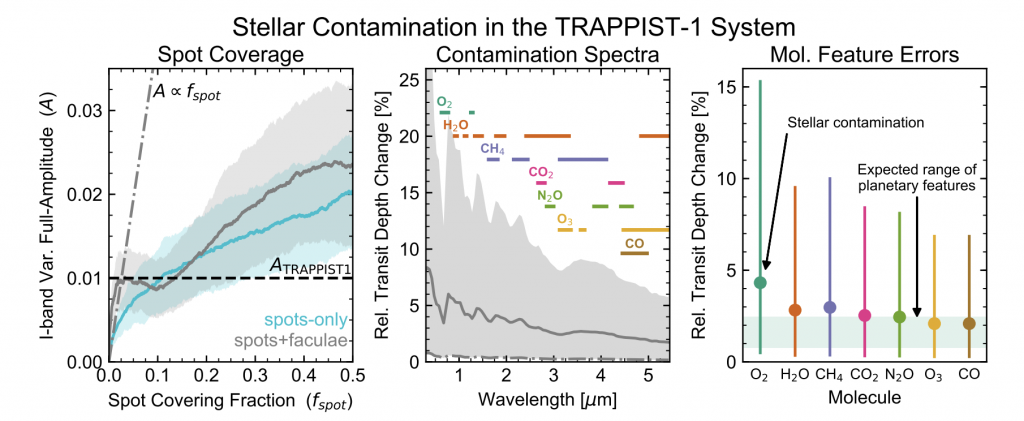
As a star rotates and spots come in and out of view, they impart a sine-wave pattern to the star’s light curve, which we observe when we look for transits; a larger fraction of the surface with spots means that the amplitude of the wave will be larger. But today’s authors show that you can’t infer the spotted fraction of a star’s surface based on the amplitude alone, because a wide range of “spottinesses” generates the same amplitude.
It’s a bleak outlook! The authors examine one famous M-dwarf planetary system, the seven-rocky-planet TRAPPIST-1, and conclude that the effect of being wrong about starspots is up to 15 times bigger than the signal of the planets’ atmospheres. It’s nigh impossible to measure anything meaningful about planetary atmospheres when there’s such a large confounding influence.

Figure 2. An investigation of the transit light source effect in the 7-planet TRAPPIST-1 system. Left panel: The amplitude of the variability in TRAPPIST-1’s light curve due to starspots is observed to be 0.01 magnitudes (black dashed line), but according to the models plotted in blue and gray, this is consistent with a huge range of starspot covering fractions (x-axis). Middle panel: The ratio of observed transit depth to true transit depth for the TRAPPIST-1 planets, across a range of wavelengths, due to starspots. Starspots cause us to overestimate the radii of planets and therefore underestimate their densities. Right panel: The ratio of observed-to-true transit depths at a handful of specific wavelengths where molecular absorption features appear. The effect of stellar contamination is up to 15 times larger than the signal expected from molecules in the atmosphere of a rocky planet (light green band), which means that we can’t currently draw any meaningful conclusions about planetary atmospheres from measurements like this. [Rackham et al. 2018]
A Call to Action
Right now, we just don’t understand stellar surfaces well enough to be confident that we’re correct in our transmission spectra. To improve our understanding, we can watch planets transit spotted stars in multiple wavelength bands to get better constraints on where the starspots are and how much area they cover. Consider it a silver lining to the recent news that the James Webb Space Telescope is delayed until 2020: we have two more years to figure out stars before it looks at any planets!
About the author, Emily Sandford:
I’m a PhD student in the Cool Worlds research group at Columbia University. I’m interested in exoplanet transit surveys. For my thesis project, I intend to eat the Kepler space telescope and absorb its strength.

1 Comment
Pingback: AAS on starspots