
Have you ever wondered what springtime is like on Saturn’s largest moon, Titan? A team of researchers has analyzed a decade of data from the Cassini spacecraft to determine how Titan’s gradual progression through seasons has affected its temperatures.
Observing the Saturn System
Though Titan orbits Saturn once every ~16 days, it is Saturn’s ~30-year march around the Sun that sets Titan’s seasons: each traditional season on Titan spans roughly 7.5 years. Thus, when the Cassini spacecraft first arrived at Saturn in 2004 to study the giant planet and its ring system and moons, Titan’s northern hemisphere was in early winter. A decade later, the season in the northern hemisphere had advanced to late spring.
A team scientists led by Donald Jennings (Goddard Space Flight Center) has now used data from the Composite Infrared Spectrometer (CIRS) on board Cassini to analyze the evolution of Titan’s surface temperature between 2004 and 2014.
Changing of Seasons
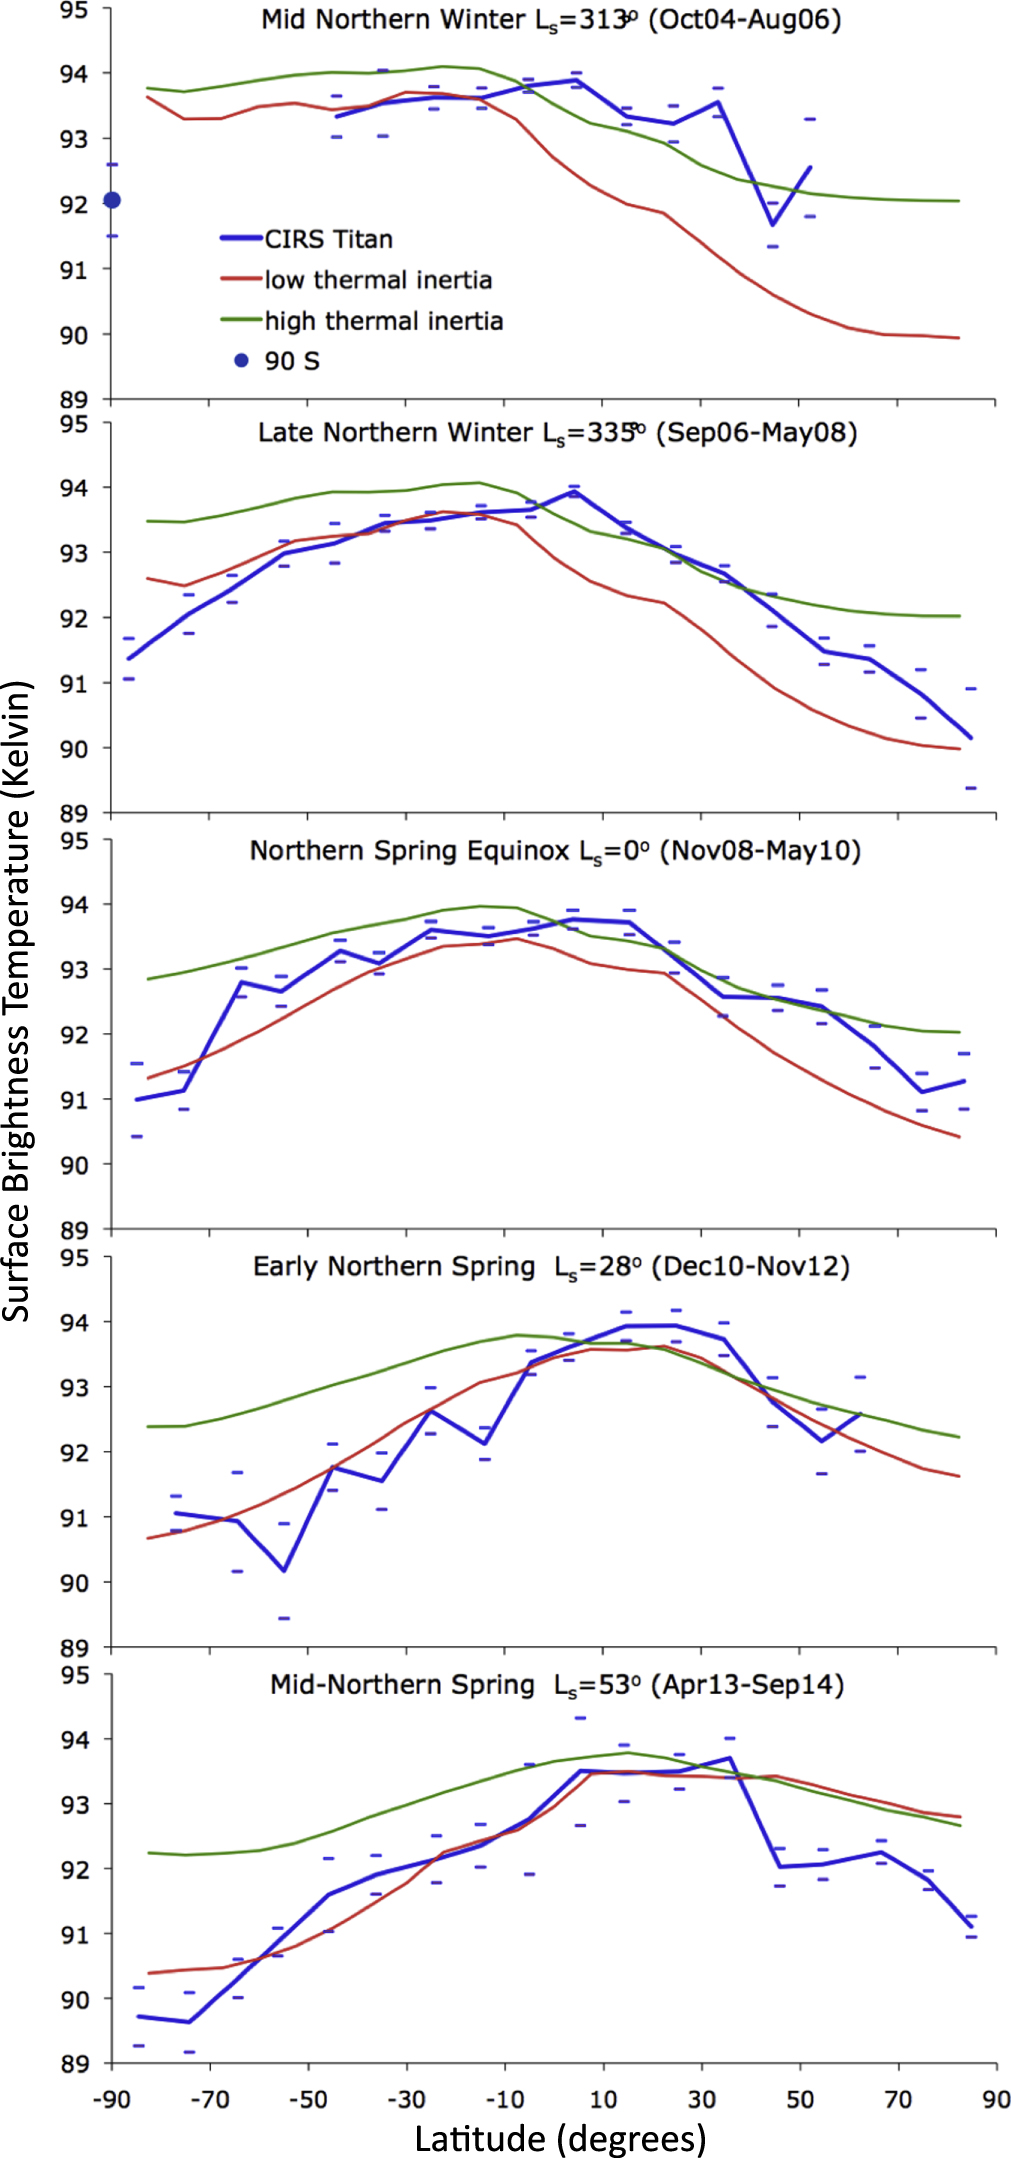
Surface brightness temperatures (with errors) on Titan are shown in blue for five time periods between 2004 and 2014. The location of maximum temperature migrates from 19°S to 16°N over the decade. Two climate models are also shown in green (high thermal inertia) and red (low thermal inertia). [Jennings et al. 2016]
The authors find that the maximum temperature on the moon stays stable over the ten-year period at 94 K, or a chilly -240°F). But as time passes, the latitude with the warmest temperature shifts from 19°S to 16°N, marking the transition from early winter to late spring. Over the decade of monitoring, the surface temperature near the south pole decreased by ~2 K, and that near the north pole increased by ~1 K.
Climate Modeling
Though Titan’s overall temperature trend is expected, the rate of change of its surface temperature doesn’t quite match theoretical climate models: the northern hemisphere lags slightly behind the predicted temperature curve. The authors speculate that this may be due to the effects of seas in Titan’s northern hemisphere. Seas of hydrocarbons (e.g., methane) are thought to account for ~10% of the moon’s surface area at latitudes of 55–90°N. Since the seas have a higher thermal inertia than land, this could explain why temperatures in Titan’s northern hemisphere lag behind the model’s predictions.
The authors hope to gain additional data in the future, as CIRS has another two years of operation planned before the Cassini mission ends. This time span will take us all the way up to Titan’s northern summer solstice; it will be exciting to see what more we can learn from this data!
Citation
D. E. Jennings et al 2016 ApJ 816 L17. doi:10.3847/2041-8205/816/1/L17