Editor’s note: This week we’re in Sun Valley, Idaho at the 16th meeting of the AAS High Energy Astrophysics Division (HEAD). Follow along to catch some of the latest news from the field of high energy astro!
Session: Black Holes Across the Mass Spectrum
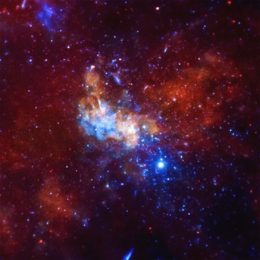
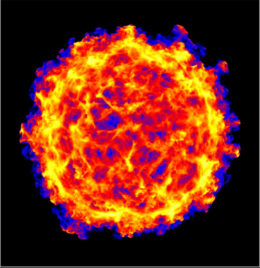
A Chandra X-ray view of our galactic center. [NASA/CXC/MIT/F.K. Baganoff et al.]
(University of Wisconsin-Madison) opened the first session on Wednesday by discussing Sgr A*, the supermassive black hole at the center of our own galaxy. Compared to the supermassive black holes we discussed on Tuesday, Sgr A* is extremely dim — but it does actively accrete matter, and its flux is therefore variable, exhibiting occasional flares. The problem? Studying this variability is tricky, because our sightline to the galactic center is subject to dust scattering, which can create apparent variability that’s
not due Sgr A*. Corrales tackled this problem by making measurements of X-ray transients in the galactic center to map the dust that lies along the sightline to the region. She and her collaborators found that dust scattering within 15 arcseconds of the galactic center accounts for a variation of 6–12% the flux of the source, with variability on timescales of hours — which means this is something we definitely have to account for when studying Sgr A*.
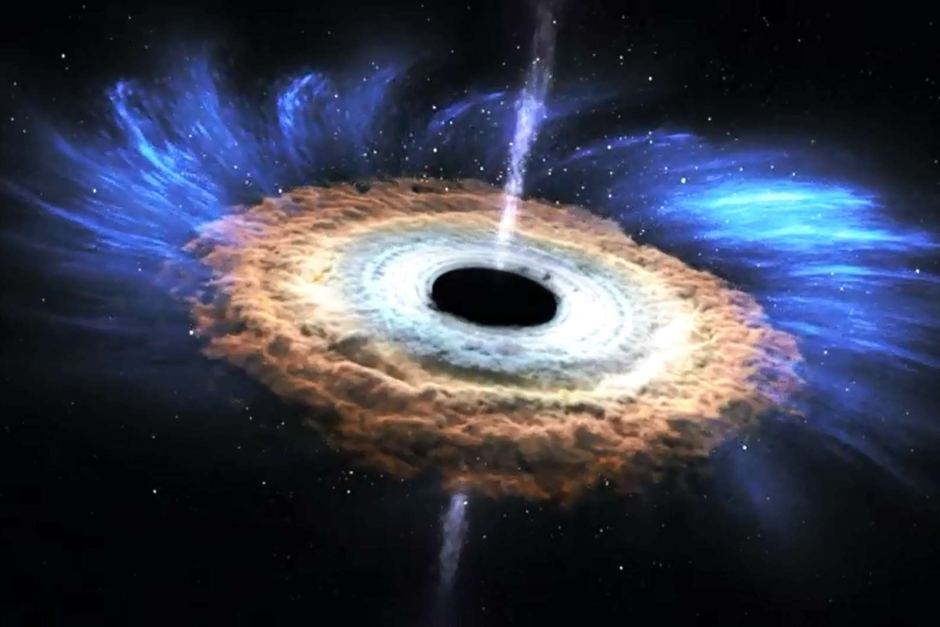
Sjoert Van Velzen (Johns Hopkins University) and Stephen Cenko (NASA GSFC) both discussed aspects of tidal disruption events (TDEs). Van Velzen addressed the question of how to tell whether the events we’re detecting are really TDEs, or if they’re imposters — accretion disk instabilities, a new kind of supernova, or collisions of stars on bound orbits around a black hole. Van Velzen pointed out that at high black-hole mass (>108 solar masses), stars will be swallowed whole instead of torn apart (remember this if you plan to fall into a black hole: it’s better to choose a high-mass one!), so we expect to see a turnover in the distribution of TDEs at high black-hole masses. Though we have only 17 observations of optical/UV TDEs, Van Velzen showed that we do, indeed, see signs of this turnover — indicating that these events are TDEs rather than impostors.
Cenko explained the sleuthing we can do with the ultraviolet spectrum from TDEs: we can infer from the emission lines that TDE disks are much more radially compact and dense than typically seen in quasars. Consistent with what we learned in Tuesday’s talks, there’s evidence in the ultraviolet spectra for low-velocity, outflowing material. And we may even be able to use abundances measured in the UV spectra to learn about the type of star that was disrupted in the event.
Giorgio Matt (University Roma Tre) moved the discussion to smaller black holes, providing an overview of what we hope to learn about microquasars with the Imaging X-ray Polarimetry Explorer (IXPE), a new mission that will launch in early 2021. IXPE will simultaneously provide imaging, spectroscopy, timing, and polarimetry measurements of sources — and the polarimetry is what will make this spacecraft unique. Matt walked us through three things that X-ray polarimetry may help us to learn about microquasars, stellar-mass black holes that are actively accreting mass from a companion star, exhibiting accretion disks and jets:
- The geometry of the corona
Microquasars are expected to have coronae just like AGN, and we may be able to constrain their geometry based on the amount of polarization we detect from them.
- The role of the jet
If jets are present and play an important role, then we expect to see much higher polarization levels.
- The spin of the black hole
Measuring the polarization angle will provide a new way of identifying the black hole’s spin.
Session: Synergies with the Millihertz Gravitational Wave Universe
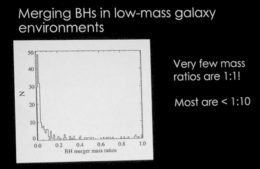
The distribution of black-hole mass ratios in Bellovary’s simulations of mergers of low-mass galaxies. The ratios are most commonly 1:10 or even lower. [Bellovary 2017]
In this session,
Jillian Bellovary (CUNY – Queensborough Community College) began by expanding on a topic first introduced on Monday: growing supermassive black holes in the early universe. Bellovary models this process using cosmological simulations, and she focuses on the direct-collapse method: low-metallicity, low-angular-momentum, massive clouds of gas collapse to form black holes, which then merge to grow. Bellovary and collaborators find that the massive black holes in low-mass, dwarf galaxies are often not directly in the center of the galaxy — they wander around, and ~50% end up off-nuclear. These have very low accretion rates (since they aren’t where the gas is); this will make them difficult to find, but observing them provides us with information about the original seed mass, since less than 10% of their mass is accreted gas. The mergers between massive black holes in low-mass galaxy environments will rarely be 1:1 mass ratios; it is much more common that the mass ratios are 1:10 or lower — which will influence the gravitational-wave signature we can expect to see from these. The upcoming LISA gravitational-wave mission will be critical for detecting these mergers from our early universe.
The next talk was given by Thomas Maccarone (Texas Tech University) on the topic of ultracompact binaries: binaries consisting of two compact objects, including white dwarfs, neutron stars, or black holes. Our current knowledge of double compact objects is very limited, as we have very few detections of these systems thus far. LISA will provide a look at some of these ultracompact binaries — and LISA’s frequency band is lower than Advanced LIGO’s, meaning that the binaries can be detected at earlier evolutionary stages, when they are evolving slowly enough for electromagnetic follow-up. LISA’s observations of these systems will help us to do astronomy with gravitational waves, including exploring binary evolution, common envelopes, kicks, etc., and probing mass distributions in globular clusters and galaxy clusters.
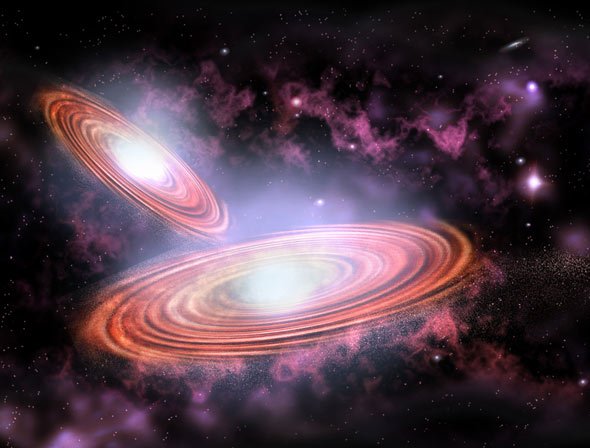
Last up, Tamara Bogdanovic (Georgia Institute of Technology) walked us through the merger of two galaxies and the supermassive black holes at their centers — mergers that LISA will be able to detect when it launches. Galaxy mergers consist of four stages:
- Stage 1: Galactic merger (separation: 100,000–1,000 pc, timescale: Gyrs)
- Stage 2: Interactions with gas and stars (separation: 1,000–10 pc, timescale: Myr–Gyr)
- Stage 3: Gravitationally bound binary (separation: 10–0.01 pc, timescale: Myrs–Gyrs)
- Stage 4: Gravitational-wave phase and coalescence (separation: <0.01 pc, timescale: short!)

Two supermassive black holes in the process of merging. [P. Marenfeld and NOAO/AURA/NSF]
How do we explore the later-stage mergers? Bogdanovic reviewed the ways that we can observe sub-parsec supermassive black-hole binaries. Direct imaging is possible, though difficult; we’ve detected one candidate using this method. Searching for quasiperiodic variability in photometry is another option, and ~150 candidates have been found in this way. These systems also have a spectroscopic signature, and another ~dozen candidates have been found by searching for this. Lastly, future detections and non-detections of gravitational-wave emission from final merger stages may result in the discovery of additional systems and provide constraints on those detected by electromagnetic means.
Dissertation Prize Talk: Stellar Death by Black Hole: How Tidal Disruption Events Unveil the High Energy Universe
2017 HEAD Dissertation Prize winner Eric Coughlin.
This year’s HEAD Dissertation Prize winner is Eric Coughlin, who did his PhD at University of Colorado Boulder and is now an Einstein Fellow at UC Berkeley. Coughlin spoke on his theoretical work studying tidal disruption events (TDEs). He noted that in TDEs, immediately after a star is torn apart and begins to accrete onto the supermassive black hole, an initial intense phase of hyperaccretion occurs. Can accretion disks even hold themselves together under this extreme release of energy?
Coughlin and his PhD advisor, Mitch Begelman, came up with a model for how these disks survive: the disks puff up into giant spherical shapes, and then any excess accretion energy is funneled from the disk into bipolar jets. They termed the puffed-up disks “zero-Bernoulli accretion flows” — ZEBRAs for short. Coughlin showed how various simulations have backed up this model, demonstrating the formation of these puffed up, spherical disks as material falls back on a supermassive black hole after the tidal disruption of a star.
Coughlin concluded his talk by presenting simulations from his more recent work, in which he explores what TDEs look like when the star is disrupted not by an isolated black hole, but by a supermassive black hole binary. Initially, the star only experiences the effects of the black hole that is disrupting it, but within short order the tidal stream of material encounters the second black hole and forms a spectacular mess of debris in beautiful patterns. This can lead to re-brightenings in the observed light curve, creating a distinctive signature that should allow us to differentiate these events from disruption events from isolated black holes. You can check out his stunning simulations yourself in the video below (you may need to give it a minute to load, but it’s worth it to watch through the end), and you can visit his website for more movies of his work.
Session: Missions & Instruments
Wednesday afternoon’s first session provided useful introductions to a number of missions, instruments, and data analysis tools for high-energy astrophysics. These included:
- Chandra Interactive Analysis of Observations (CIAO)
Antonella Fruscione (Smithsonian Astrophysical Observatory) discussed this modern data-analysis system for examining images produced by the Chandra X-ray Observatory.
- 360° movies of X-ray data in the galactic center
Christopher Russell (NASA GSFC) shared his unusual 360° movies of our galactic center’s inner parsec, created from hydrodynamic simulations that model X-ray emission from hot stars in the center of the galaxy. You can check it out yourself by visiting this link on your computer, or by searching for “Christopher Russell astronomy” in the youtube app on your phone (recommended for the full 360° experience!).
- Compton Spectrometer and Imager (COSI)
Clio Sleator (SSL, UC Berkeley) introduced this balloon-borne soft gamma-ray detector, which floated for 46 days in 2016. Data from this run included observations of the Crab pulsar and the gamma-ray burst GRB 160530A.
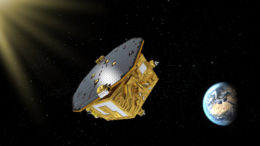
Artist’s illustration of LISA Pathfinder. [ESA/C.Carreau]
James Thorpe (NASA GSFC) provided us with an overview of the pathfinding mission for the Laser Interferometer Space Antenna (LISA). LISA Pathfinder was intended to test some of the technologies required for LISA, which will rely on incredibly high-precision engineering. Initial data from this pathfinder mission have shown that it’s exceeded the requirements for LISA, which is extremely promising for the future mission!- Arcus
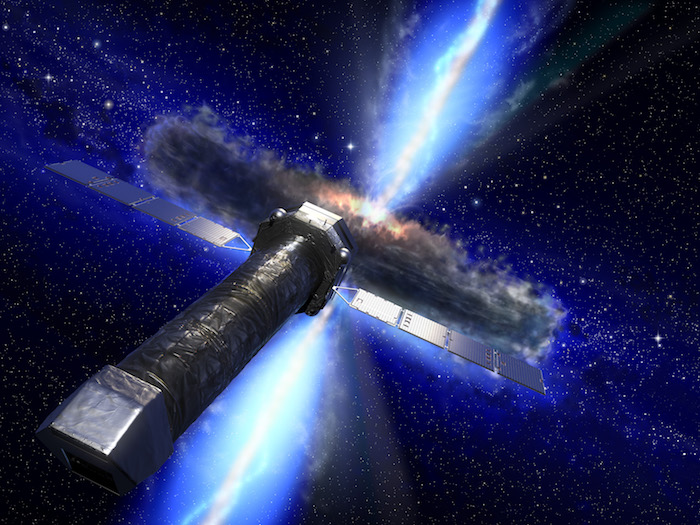
Randall Smith (Smithsonian Astrophysical Observatory) gave us a cheerful overview of Arcus, a free-flying X-ray satellite that was recently selected by NASA for a concept study as a Medium-Class Explorer mission. If ARCUS makes it to the final phase of the proposal process and launches (as early as 2022), it will significantly improve on views from current missions like Chandra, providing us with new information on the formation and evolution of clusters of galaxies, black holes, and stars.
- All-sky Medium Energy Gamma-ray Observatory (AMEGO)
Sara Buson (NASA GSFC) presented on the mission AMEGO, soon to be proposed to the 2020 Decadal Review, which would provide an all-sky survey of emission in the MeV energy band. AMEGO will provide at least a 20x improvement on sensitivity relative to its predecessor, COMPTEL, allowing us to better explore sources like MeV blazars. We hope to use AMEGO to shed light on supermassive black-hole growth, the accretion–jet connection, the MeV background, and much more.

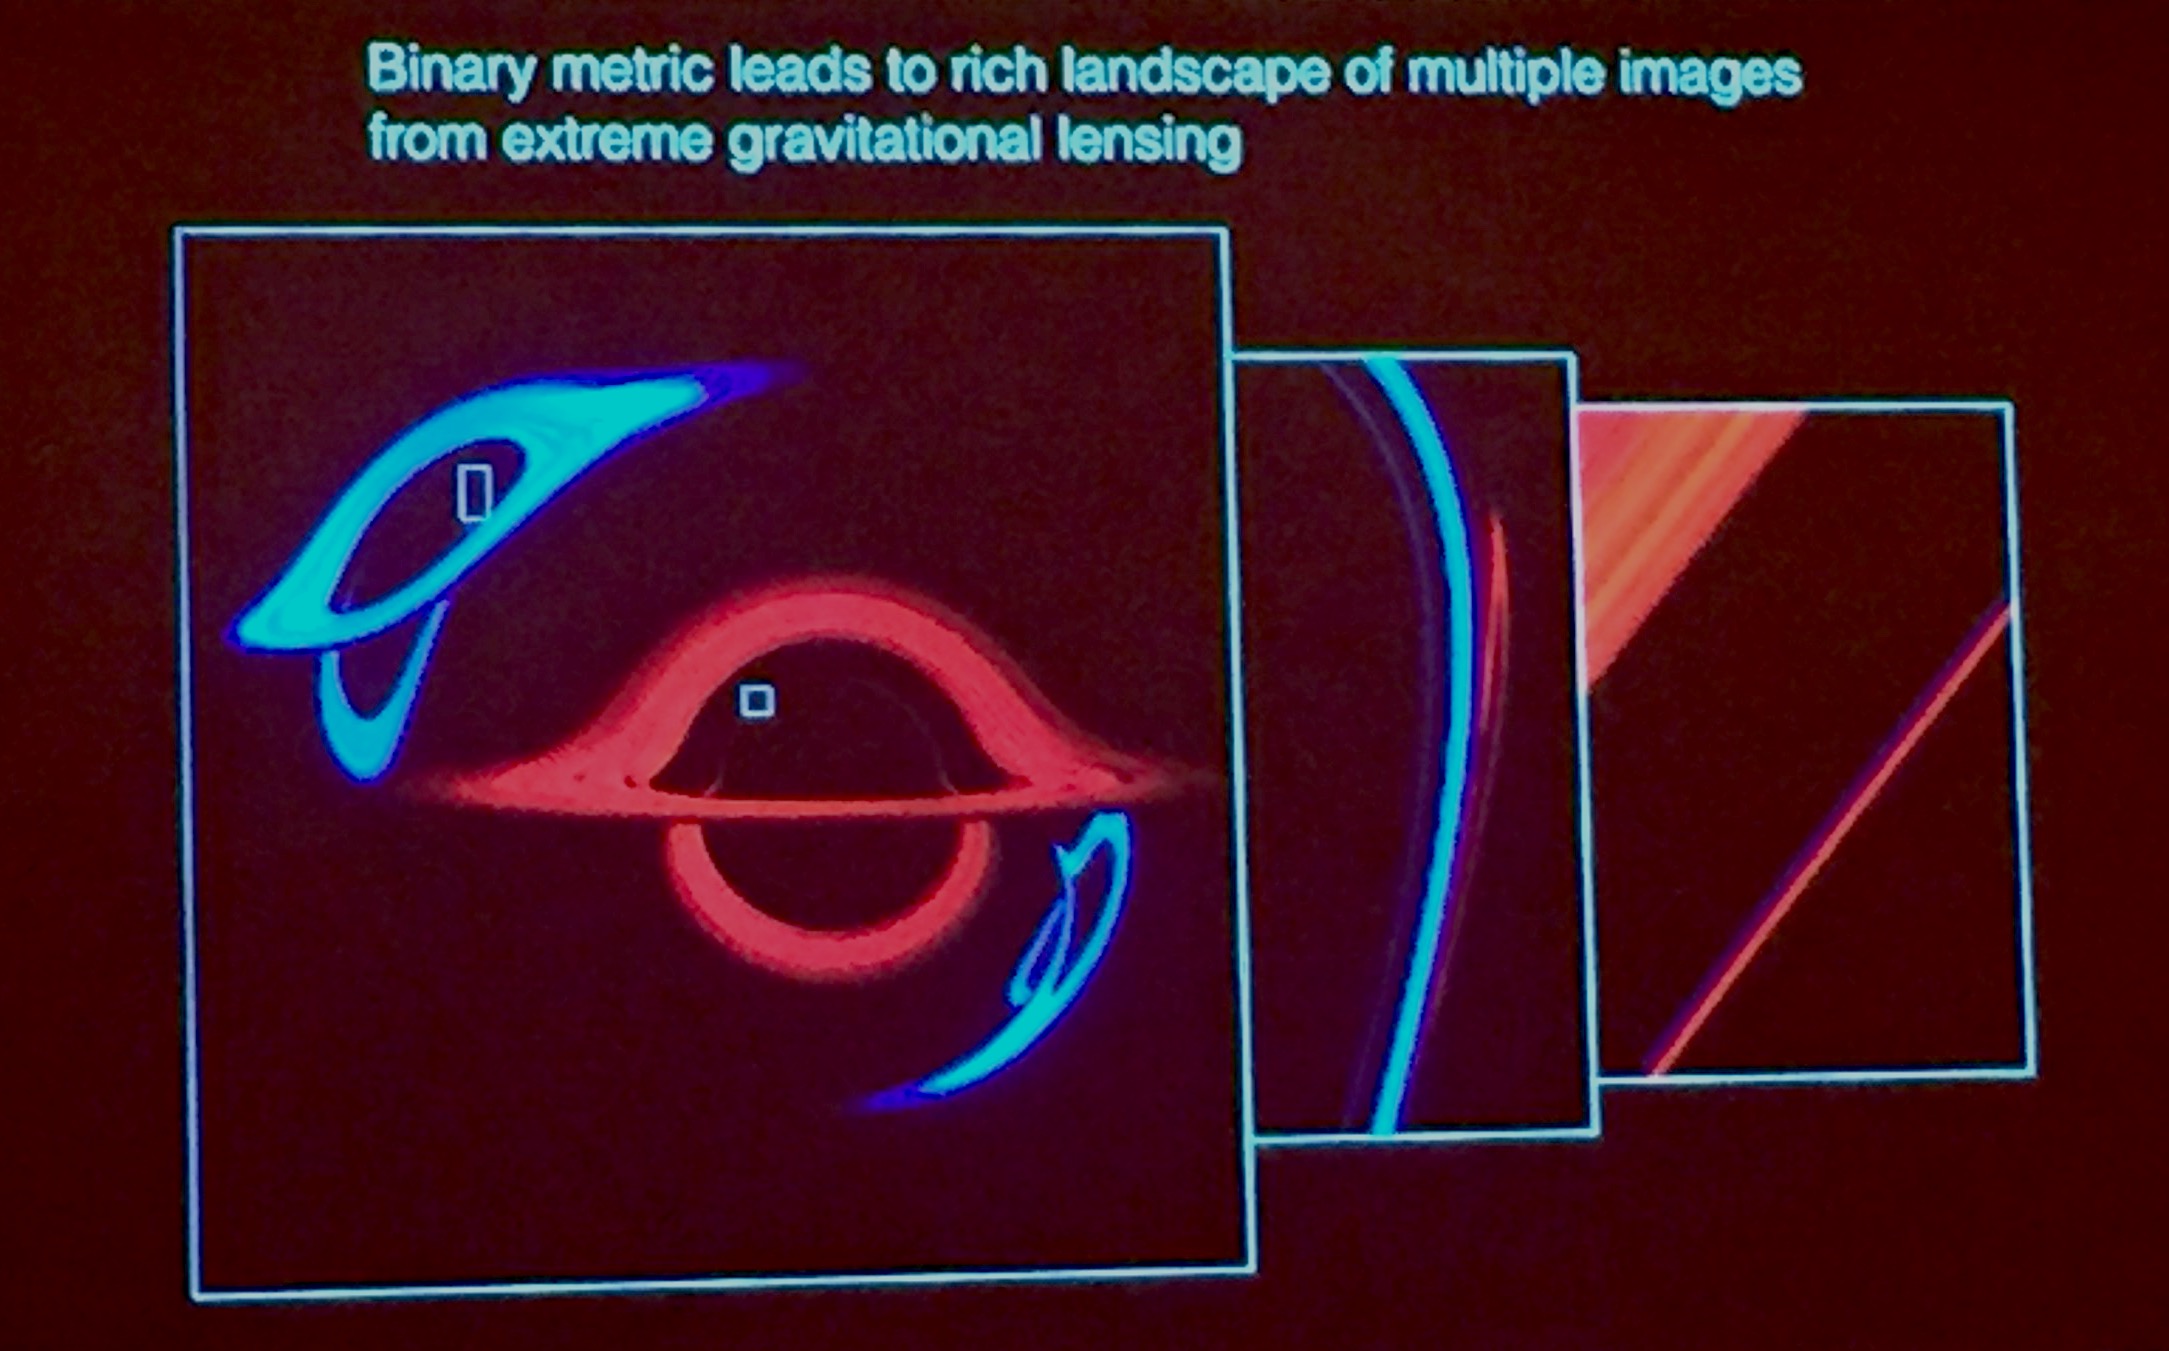
Schnittman’s simulations illustrate the strange lensing effects that occur when two accreting black holes orbit each other. [Schnittman 2017]
Session: SNR/GRB/Gravitational Waves
This session was termed by the first speaker, Jeremy Schnittman (NASA GSFC), as “the miscellaneous session.” The first two talks focused on intriguing aspects of gravitational-wave astronomy. Schnittman presented his work modeling the complex radiation physics in the time-dependent spacetimes of a binary compact-object system. What would we expect to see when two black holes accreting gas are locked in a close binary? Schnittman modeled this with a radiation transport calculation of the gas accretion onto the merging binary black holes, and then used ray-tracing of photons to determine what a distant observer would see.
Cecilia Chirenti (UFABC) discussed the gravitational waves that are emitted from highly eccentric neutron-star binaries — not from the binary as a whole, but from the oscillation modes that are induced in the individual neutron stars as a result of their close passages. She demonstrated that the proposed Einstein Telescope should be able to detect up to tens of these events per year, and we may be able to use these detections to help constrain the neutron-star equation of state.
The next two speakers discussed various aspects of modeling the aftermath of supernovae. Tea Temim (Space Telescope Science Institute) presented her work simulating the interaction of a pulsar wind nebulae (which is generated by the pulsar embedded deep within a supernova remnant) with the supernova reverse shock. By matching her simulations with observations, she hopes to obtain information about the ambient medium, the supernova ejecta, the pulsar properties, and the energetic particle population injected into the interstellar medium.
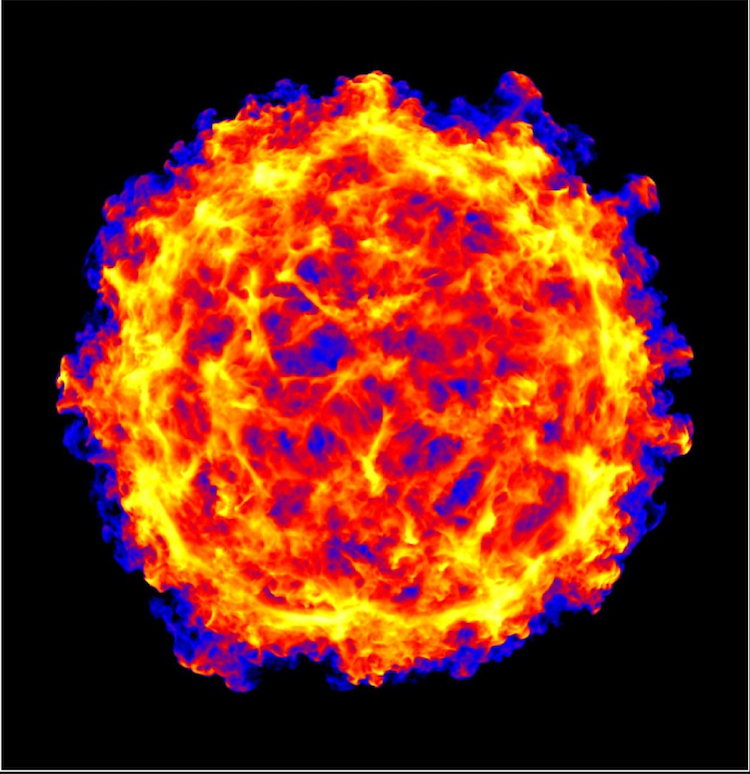
One of Williams’ models of the Tycho supernova remnant. [Williams et al. 2017]
(Space Telescope Science Institute) then discussed his three-dimensional modeling of the ejecta from Tycho’s supernova remnant, which I’ve written about in
a previous AAS Nova post.
Closing out the session, Colleen Wilson-Hodge (NASA MSFC) gave an overview of the time-domain astronomy done with the Fermi Gamma-ray Burst Monitor (GBM). GBM’s large field of view — and the fact that it scans the sky once every ~90 minutes — has allowed it to detect a number of gamma-ray bursts, as well as to regularly monitor pulsars and galactic transients. In the current era of multi-messenger astronomy, GBM has also been used to follow up on gravitational-wave triggers from LIGO and neutrino detections from IceCube. We can only hope that it will prove successful in similar follow-up campaigns in the future!


.jpg)