
Editor’s Note: Astrobites is a graduate-student-run organization that digests astrophysical literature for undergraduate students. As part of the partnership between the AAS and astrobites, we occasionally repost astrobites content here at AAS Nova. We hope you enjoy this post from astrobites; the original can be viewed at astrobites.org.
Title: The AURORA Survey: The Nebular Attenuation Curve of a Galaxy at z = 4.41 from Ultraviolet to Near-Infrared Wavelengths
Authors: Ryan L. Sanders et al.
First Author’s Institution: University of Kentucky
Status: Published in ApJ
Imagine a galaxy from 13 billion years ago, long before the Milky Way took its current form. Now picture trying to uncover the secrets of that ancient galaxy. How quickly did it create stars and evolve? Here’s the tricky part: its light has journeyed across an unimaginable distance to get here. On its journey, cosmic dust — tiny grains of carbon and silicates — has scattered and dimmed the light, making the task harder.
Dust doesn’t just block light — it changes it. Ultraviolet (UV) light gets scattered much more than light at longer wavelengths, which is why galaxies seem redder and dimmer than they truly are. This dual nature can be seen in the “Pillars of Creation,” in Figure 1. A new near-infrared image from NASA’s JWST, shown in the right panel below, helps us peer through more of the dust in this star-forming region. The thick, dusty brown pillars are no longer as opaque, and many more red stars that are still forming come into view.
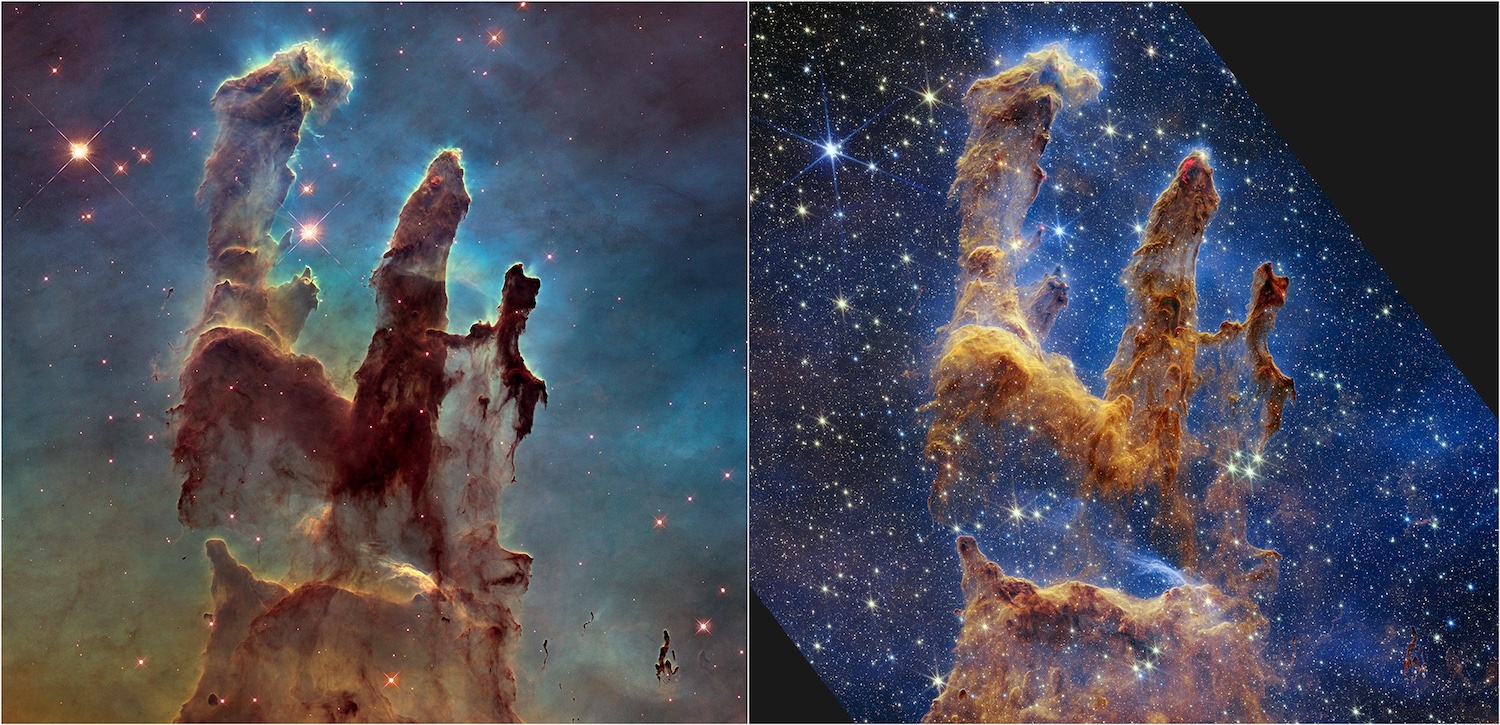
Figure 1: On the left, NASA’s Hubble Space Telescope captures the iconic Pillars of Creation in stunning visible light (2014). On the right, JWST unveils a breathtaking infrared view, revealing even more details hidden within the cosmic dust. [NASA, ESA, CSA, STScI; Joseph DePasquale (STScI), Anton M. Koekemoer (STScI), Alyssa Pagan (STScI)]
But here’s the catch: most of the dust curves we have were designed for galaxies much closer to us, like the Milky Way or the SMC, so they may not apply in the exact same way to distant galaxies. Whether those same curves work for the much younger, chaotic galaxies of the early universe is an open question. The dust in nearby galaxies is well studied and relatively predictable, but does dust behave the same way in galaxies billions of years in the past?
This question drove Ryan Sanders and collaborators to study GOODSN-17940, a starburst galaxy located at a redshift of z = 4.41, when the universe was just 1.36 billion years old. Observed as part of the Assembly of Ultradeep Rest-optical Observations Revealing Astrophysics (AURORA) survey using JWST, this galaxy provided an unprecedented opportunity to investigate how dust behaved in the distant past. Using JWST’s NIRSpec instrument, the team constructed a unique dust curve by studying 11 hydrogen emission lines from Hα to H12 (the twelfth line in the rest-frame optical Balmer series), shown in Figure 2. These lines act like lighthouses, their brightness giving away how much light is being absorbed by dust at each wavelength. By comparing the observed brightnesses of these lines, the researchers created a detailed dust curve tailored to GOODSN-17940.
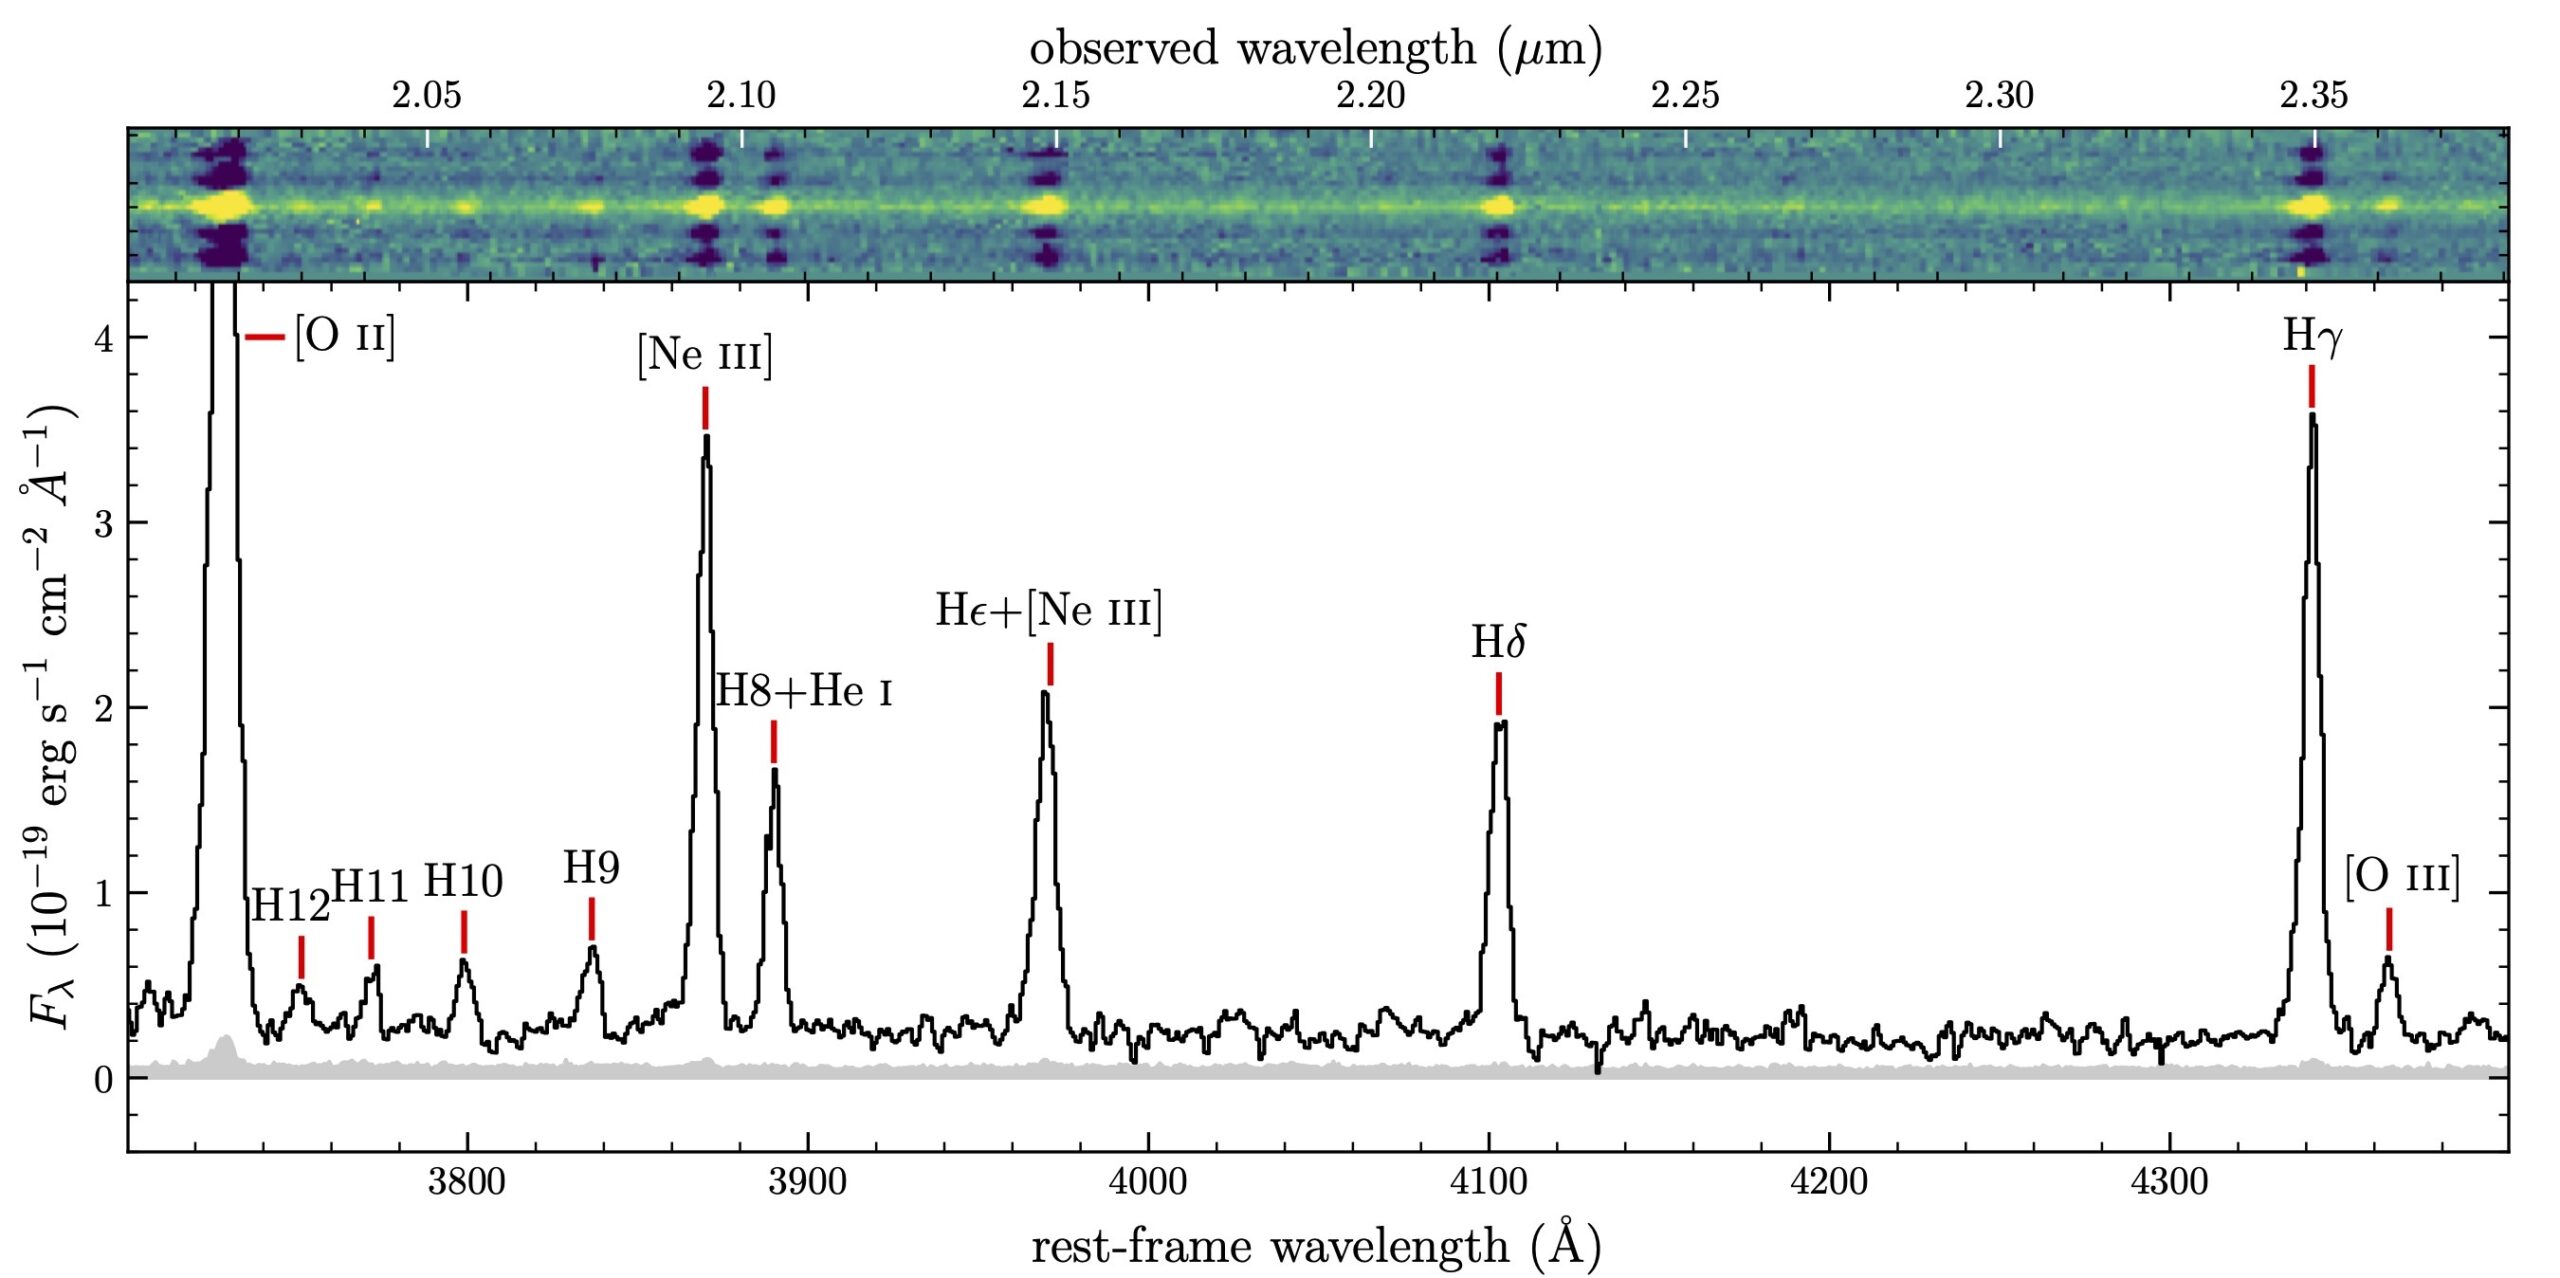
Figure 2: Spectrum of GOODSN-17940 from the AURORA survey, showing hydrogen Balmer lines. These features help estimate the galaxy’s dust and ionization conditions. The top panel presents the 2D spectrum, showing spatially resolved emission that traces the galaxy’s structure, while the bottom panel shows the corresponding 1D spectrum. [Adapted from Sanders et al. 2025]
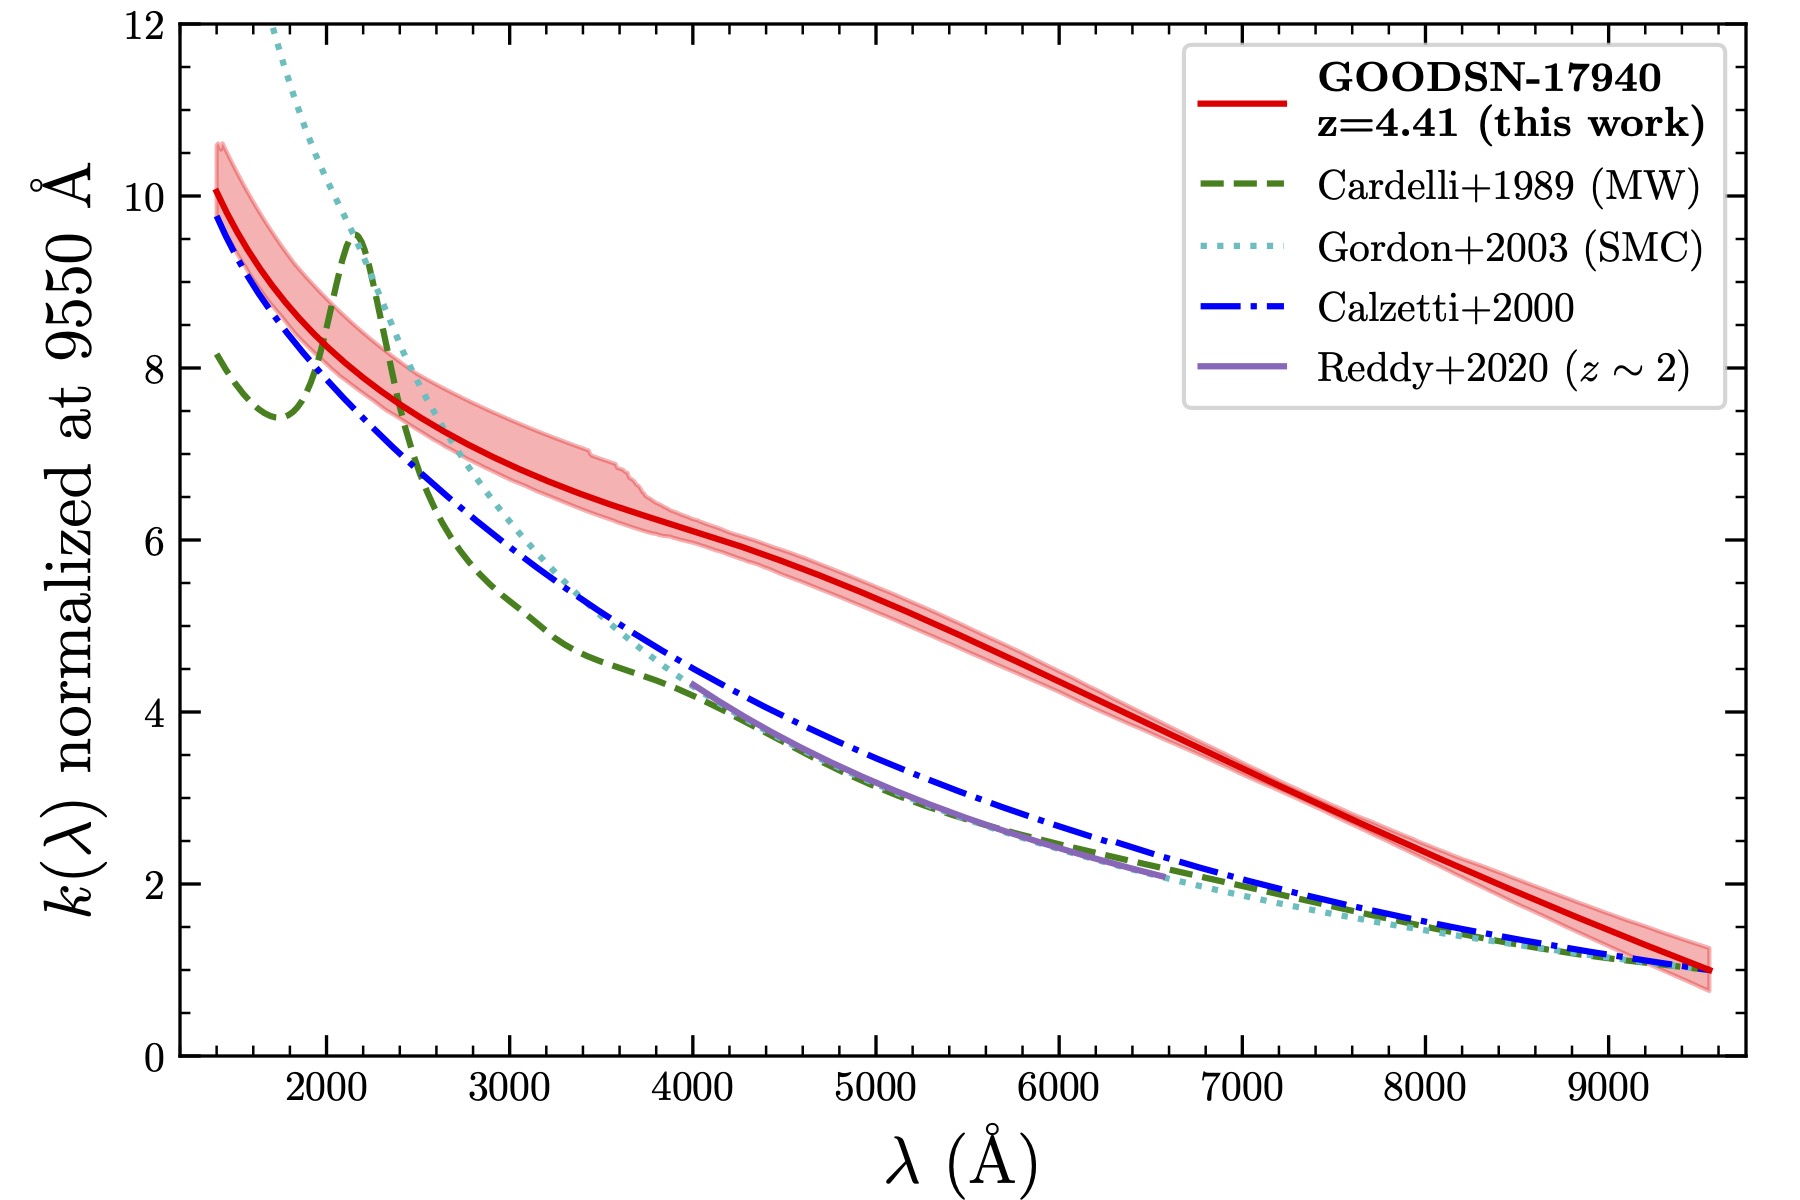
Figure 3: The dust curve of GOODSN-17940 (solid red line) at z = 4.41, derived in this work, compared to established curves for the Milky Way (green dashed), Small Magellanic Cloud (SMC, dotted cyan), Calzetti et al. (blue dot-dashed), and Reddy et al. z ~ 2 galaxies (purple solid). This curve is steeper in the near-infrared and flatter in the UV, highlighting unique dust properties in this galaxy. [Sanders et al. 2025]
So, why does this even matter? If you used the Milky Way’s dust curve to adjust for the dust in a galaxy like GOODSN-17940, you’d be way off. In fact, you’d underestimate its star formation rate by up to 50%! This isn’t just a minor detail — it could explain why star formation rates derived from Hα don’t always match those derived from UV luminosity. Such details can completely change how we interpret a galaxy. It’s the difference between a galaxy steadily forming stars and one caught in a dramatic starburst phase. That’s why astronomers focus on creating dust curves tailored to individual galaxies. This study isn’t just about one galaxy — it’s about rethinking how we interpret dust, star formation, and galaxy evolution in the early universe. Before JWST, isolating individual emission lines from distant galaxies was challenging, but it has become much more efficient now. As more galaxies like GOODSN-17940 are studied, we might find that many early galaxies had dust curves breaking the mold, forcing us to refine how we measure star formation and understand cosmic history.
Original astrobite edited by Hilary Diane Andales and Delaney Dunne.
About the author, Niloofar Sharei:
I’m a third-year Astronomy PhD student at University of California, Riverside, where I study bursty star formation histories and how galaxies take shape. When I’m not busy exploring the universe, you can usually find me curled up with a good book, hiking somewhere peaceful, trying astrophotography, or getting lost in Bach’s music and art.