
Editor’s Note: Astrobites is a graduate-student-run organization that digests astrophysical literature for undergraduate students. As part of the partnership between the AAS and astrobites, we occasionally repost astrobites content here at AAS Nova. We hope you enjoy this post from astrobites; the original can be viewed at astrobites.org.
Title: A Novel Approach to Understanding the Link Between Supermassive Black Holes and Host Galaxies
Authors: Gabriel Sasseville et al.
First Author’s Institutions: University of Montreal; Ciela—Montreal Institute for Astrophysical Data Analysis and Machine Learning; Center for Research in Astrophysics of Québec
Status: Published in ApJ
Most galaxies are thought to host a central supermassive black hole, and these black holes play a crucial role in shaping how galaxies evolve. There is a strong connection found between the properties of a galaxy and its central black hole. One of the most well-known examples is the relationship between the black hole’s mass and the random motions of stars near the galaxy’s center, measured by a quantity called stellar velocity dispersion (denoted as σ). This connection, known as the M–σ relationship, has been studied for decades and is often used to estimate the mass of a galaxy’s central black hole.
Interestingly, some galaxies appear to lack a central black hole. In many cases, observations only provide an upper limit on the possible mass of any black hole that might be there. In today’s article, the authors study the M–σ relationship with a new statistical approach to account for galaxies that might not have a central black hole and improve the calculation of this relationship.
Hurdle Up, the Bayesian Way
The authors use a statistical method called the Bayesian hurdle model. To update our understanding, Bayesian modeling combines prior beliefs or initial guesses with new evidence. The Bayesian hurdle model approach tackles two key questions: first, whether a galaxy is likely to host a central black hole, and second, if it does, how the black hole’s mass relates to the galaxy’s velocity dispersion (σ). The model works in two stages. In the first step, called the “hurdle,” a logistic regression determines the probability that a galaxy has a central black hole. If the galaxy clears this hurdle (i.e., is likely to host a black hole), the second step uses linear regression to establish the relationship between the black hole’s mass and the galaxy’s velocity dispersion, analyzed on a logarithmic scale.
The study examines a sample of 244 galaxies where either the central black hole mass has been measured directly or an upper limit has been estimated. From the logistic regression step, the authors find that galaxies with σ > 126 km/s have a 99% probability of hosting a central black hole. This result suggests that while massive galaxies are almost certain to have black holes, smaller dwarf galaxies are much less likely to host them.
A Steeper Correlation
The hurdle model reveals a relationship of M ∝ σ5.8 between black hole mass and velocity dispersion, as shown in Figure 1 (solid black line). This result is steeper than the correlations found in previous studies. The difference likely arises from the authors’ inclusion of upper limits on black hole masses in their hurdle model analysis. The hurdle model also predicts several under-massive black holes in the range of 101–105 solar masses compared to other linear model studies. This downward shift in the lower mass range compared to other models is seen in Figure 1. Also, the breakpoint between under-massive and over-massive black holes occurs at a lower mass than previously reported. This shift is due to the hurdle model’s handling of upper limits in the logistic regression step, which pulls the curve downward.
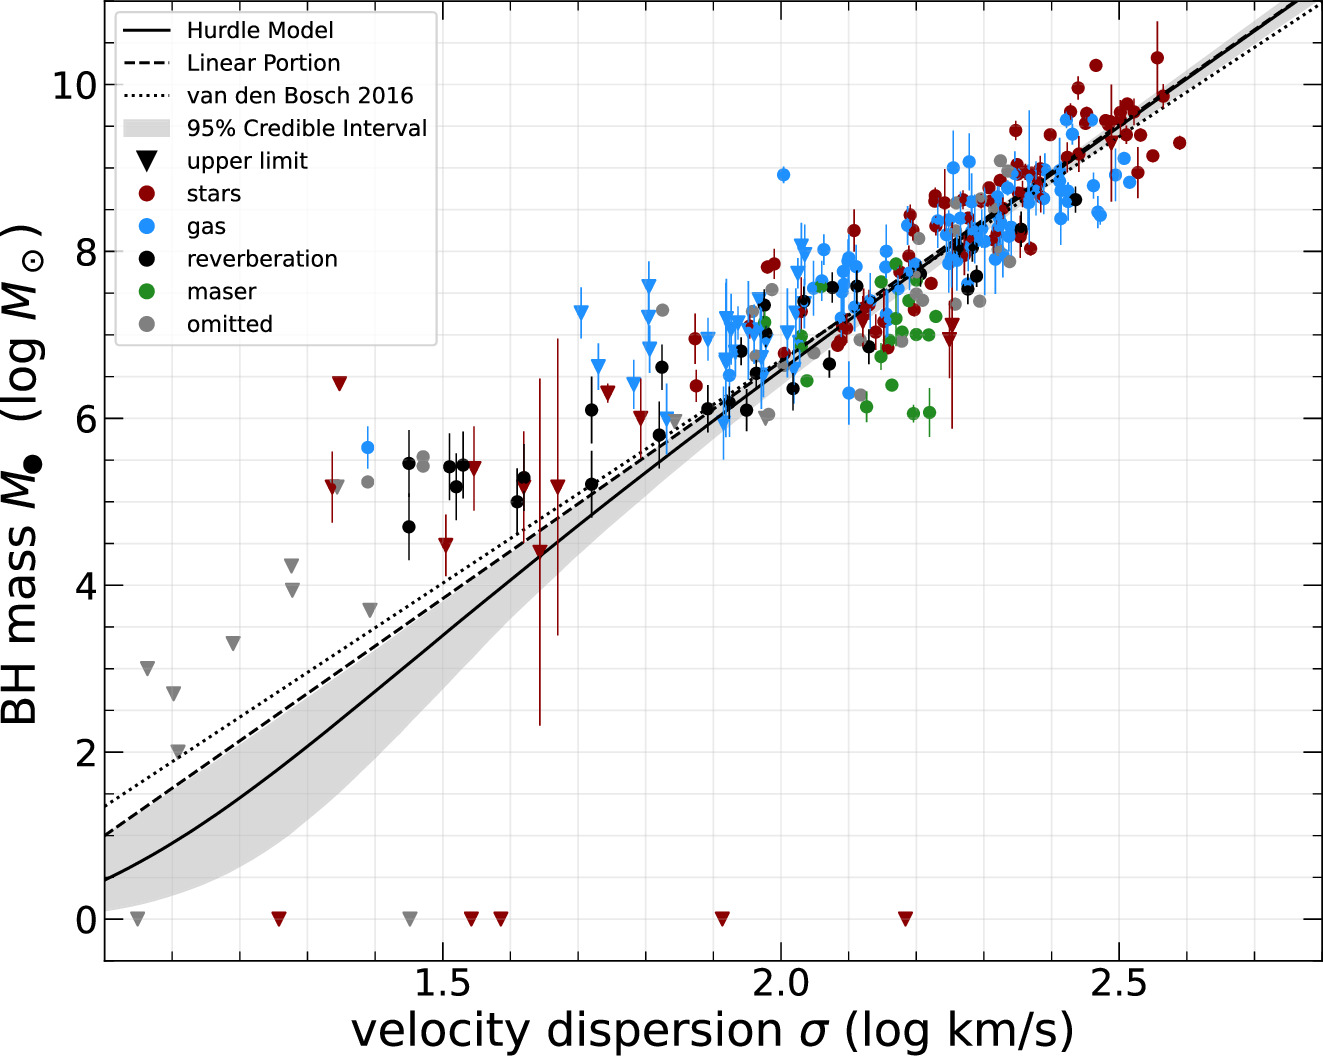
Figure 1: Relationship between the black hole mass and velocity dispersion (σ). The upper limits on the black hole masses are plotted in triangles while the circles indicate more precise measurements. The dotted black line shows the linear fit obtained in a previous study of this correlation. The hurdle model fit is shown as a solid black line while the dashed black line is the linear portion of the fit. Notice that the slope of the hurdle model fit (solid black line) is steeper than the fit from the previous study (dotted black line). [Sasseville et al. 2025]
Original astrobite edited by Cole Meldorf.
About the author, Pranav Satheesh:
I am a graduate student in physics at the University of Florida. My research focuses on studying supermassive binary and triple black hole dynamics using cosmological simulations. In my free time, I love drawing, watching movies, cooking, and playing board games with my friends.