
Editor’s Note: Astrobites is a graduate-student-run organization that digests astrophysical literature for undergraduate students. As part of the partnership between the AAS and astrobites, we occasionally repost astrobites content here at AAS Nova. We hope you enjoy this post from astrobites; the original can be viewed at astrobites.org.
Title: The Small Sizes and High Implied Densities of “Little Red Dots” with Balmer Breaks Could Explain Their Broad Emission Lines Without an Active Galactic Nucleus
Authors: Josephine F. W. Baggen et al.
First Author’s Institution: Yale University
Status: Published in ApJL
Since its launch, JWST has been on a roll with observations that continue to shape our understanding of the universe. Recently, JWST saw a bunch of galaxies in the early universe that could each host a massive black hole. These galaxies are rightfully called “little red dots” as they are compact (i.e., have small radii) and appear red in the infrared as observed by JWST. However, we are not entirely sure about the identity of the little red dots. The spectra of these galaxies seem to contain features that suggest the presence of an accreting supermassive black hole or AGN. AGNs are known to produce X-ray emission, and we have not detected X-rays from the little red dots. So, what exactly are the little red dots? Do they have an AGN, or are they simply a collection of very massive and compact galaxies?
A recent finding showed that three little red dots have a relatively old and evolved stellar population. We know this because of the presence of a Balmer break — a jump in the galaxy spectrum at the Balmer line — which is predominantly seen in older stars. Does this mean that these galaxies are dominated by older, evolved stars, and does that rule out the presence of AGNs? The authors of today’s article argue that the three little red dots with a Balmer break have no AGNs and are just massive, compact galaxies. Have they truly unmasked the little red dots? Let’s find out.
These Are Some Extremely Dense Galaxies
The authors find that the galaxies are extremely compact, with small half-light radii around 100 parsecs (326 light-years), similar to ultra-compact dwarf galaxies in the local universe. While the galaxy spectra can give us an estimate of the stellar mass, the contribution from the AGN alone can be a significant fraction of a galaxy’s mass and must be accounted for. The authors fit three models to the galaxy spectra: 1) assuming most of the galaxy’s light comes from an old, evolved stellar population with no contribution from an AGN, 2) assuming maximum contribution from an AGN and minimal from the stars, and 3) a model that lies somewhere in between. The three models yield very different galaxy mass estimates, with the first model estimating 100 billion solar masses in stars, and the second model estimating just a billion solar masses.
The detection of the Balmer break points toward a source that has light mostly dominated by stars. Assuming the AGN contribution to the mass is minimal, the stellar mass density would be quite high. The authors show this in Figure 1, where the model with no AGN component is shown in purple and exhibits a very high stellar mass density near the galaxy’s center compared to other galaxies. This could be taken as evidence against the no-AGN model, but there is another observation we should consider.
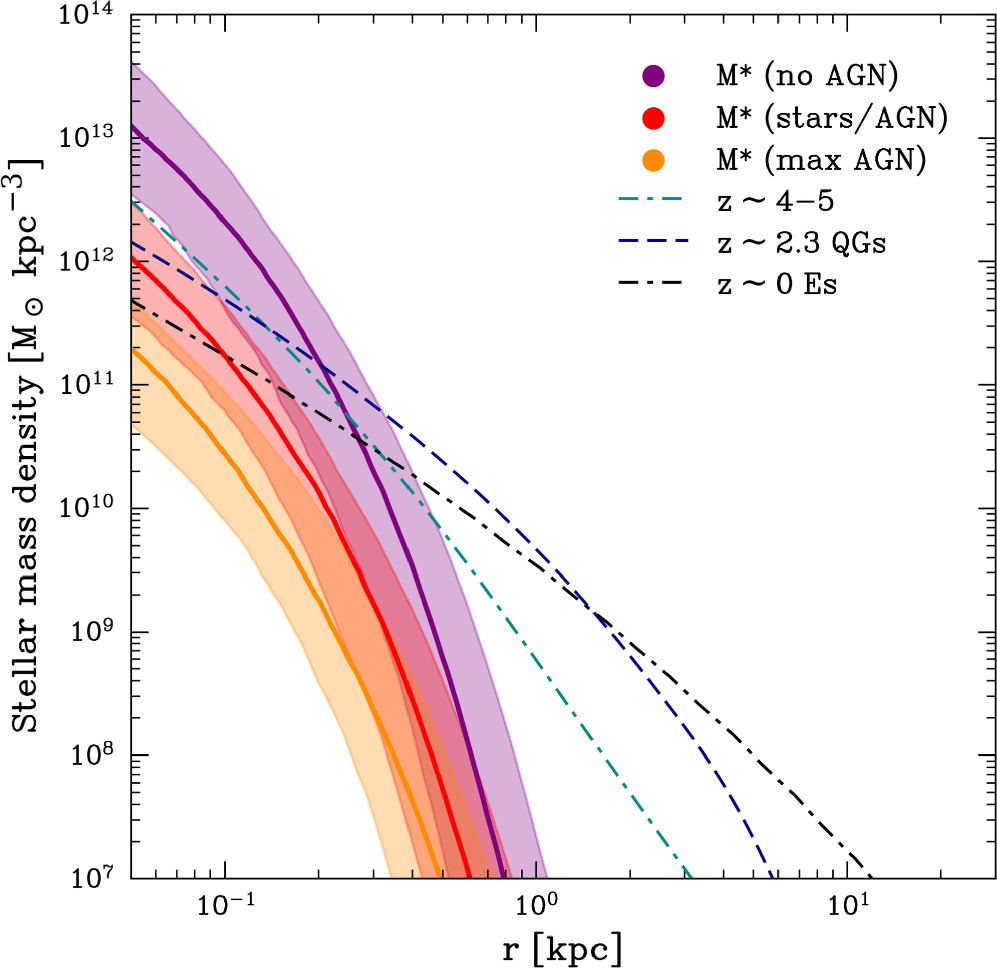
Figure 1: The stellar mass density profile — stellar mass density versus the distance from the center — for the three different models. The purple profile is for the no-AGN model. The black dotted line shows the profiles of galaxies from the local universe. The cyan and purple dotted lines show the profiles at higher redshifts. The no-AGN model’s stellar mass profile indicates a higher central density than other models. [Baggen et al. 2024]
What About the Broad Emission Line?
One of the clearest signatures of an AGN in the galaxy spectra comes from broad emission lines, which result from fast-moving gas near the supermassive black hole moving both toward and away from us. This causes a Doppler broadening of the emission lines. This associated velocity dispersion was measured in the three little red dot galaxies in today’s article.
The authors argue that the calculated velocity dispersion can be explained by the dynamics of gas and stars in the galaxy itself, without the need for an AGN. This is because of the galaxy’s extreme density, which can produce a spectral line width that is similar to that of an AGN’s broad emission line. In Figure 2, the authors show a plot of the observed velocity dispersion versus the predicted velocity dispersion, assuming it is the gas and stars present in the galaxy that are contributing to the Doppler broadening. The predicted and observed velocity dispersions seem to match very well for the model with no AGN contribution. This also provides a natural explanation for the lack of X-ray signatures in these galaxies, since we would expect to see X-ray emission if AGNs were present but no such emission from an ordinary stellar population.

Figure 2: Left: A plot of the observed versus predicted stellar velocity dispersion assuming the kinematics of the gas and stars in the dense galaxy contributing to the broad line emission. In the no-AGN model, the three little red dots (indicated by the purple square, rectangle, and pentagon) can explain the observed stellar velocity dispersion. Right: A schematic figure showing that the observed H-beta line widths can be accounted for by the velocity dispersion calculated from the kinematics. [Baggen et al. 2024]
Verdict: We Need More Evidence
However, further investigation is needed to determine if this scenario can explain every aspect of the little red dots. Additionally, the origins of such extremely dense galaxies are uncertain, and we need to understand how they evolve into the “normal” galaxies with lower central densities and larger sizes that we see today. The authors stress that the explanation of the little red dot spectra being dominated by AGNs rather than stars is still likely, and further observations are needed to uncover the truth.
Original astrobite edited by William Smith.
About the author, Pranav Satheesh:
I am a second-year graduate student in physics at the University of Florida. My research focuses on studying supermassive binary and triple black hole dynamics using cosmological simulations. In my free time, I love drawing, watching movies, cooking, and playing board games with my friends.