
Editor’s Note: Astrobites is a graduate-student-run organization that digests astrophysical literature for undergraduate students. As part of the partnership between the AAS and astrobites, we occasionally repost astrobites content here at AAS Nova. We hope you enjoy this post from astrobites; the original can be viewed at astrobites.org.
Title: XRISM Spectroscopy of the Fe Kα Emission Line in the Seyfert Active Galactic Nucleus NGC 4151 Reveals the Disk, Broad-line Region, and Torus
Authors: XRISM Collaboration
Status: Published in ApJL
Today we’re going to be taking a high-resolution look at X-rays from close to a supermassive black hole! But before we get into the astrophysics of today’s article, we first need to discuss the instruments that were built to do this science. More than 50 years ago now, charge-coupled devices (CCDs) began revolutionizing astronomy, and they continue to be one of the most commonly used detectors on telescopes. CCDs rely on the photoelectric effect, through which an incoming photon can liberate electrons in some material (semiconductors in the case of CCDs). These electrons are trapped by strong potential wells and electric charge can be applied to move the charge along and read this signal (check out this Astrobite for more details). CCDs are particularly powerful in the X-ray band, where the number of electrons trapped in each pixel scales roughly with the photon energy. This means that you get energy information (i.e., a spectrum) for free with CCDs! However, CCDs have limited spectral resolution, meaning they can’t determine this energy very precisely and therefore cannot resolve and unlock the power of narrow emission and absorption lines.
X-Ray Microcalorimetry and 20/20 Vision
Figure 1: Schematic showing how a microcalorimeter works. An X-ray photon with energy E will produce a spike in the temperature of the absorber of E/C, where C is the heat capacity of the absorber. The thermometer is extremely sensitive to small changes in temperature, which means that we can get very accurate energies for each of the incoming X-ray photons. Therefore, a microcalorimeter can produce an X-ray spectrum with the best energy resolution of any current instrumentation. [NASA]
Now, XRISM isn’t actually the first X-ray microcalorimeter to fly, but it’s the first to live through its commissioning phase! Although the X-ray microcalorimeter has been in the works since the 1990s, previous X-ray microcalorimeters have been cut from missions, lost to launch failures, and left unable to operate due to loss of coolant for the detector. In 2016, JAXA successfully launched and operated the first X-ray microcalorimeter on the Hitomi Satellite. However, unfortunately, shortly after taking a beautiful spectrum of the Perseus Cluster, one of the best-studied galaxy clusters in the local universe, communication was lost with the satellite and never recovered. XRISM’s Resolve instrument has been the most successful X-ray microcalorimeter so far, and it has allowed us to start looking at the universe with 20/20 X-ray vision!
Supermassive Science with XRISM
Today we’re going to put on our high-resolution X-ray spectroscopy glasses to look at one of the first XRISM targets: NGC 4151, one of the most well-known active galactic nuclei in the local universe. An active galactic nucleus consists of a supermassive black hole that is gobbling down gas from its surroundings through a process known as accretion. While we’ve known about active galactic nuclei for more than 50 years now, we still don’t really understand how they are fueled and what the structure is around them. XRISM can unlock this information indirectly by resolving some of the key X-ray emission and absorption lines. In particular, the most prominent emission line in the X-ray spectrum of an active galactic nucleus is a neutral iron Kα line at 6.4 kiloelectronvolts (keV), which arises from material around the supermassive black hole being illuminated by the light from the accretion process. This line holds the keys to probing the structure of the surrounding gas, as its dynamics can tell us about the structure of the accretion disk and trace gas in the torus that is thought to connect the local host galaxy to the accretion flow.
Figure 2 shows the XRISM Resolve spectrum of NGC 4151 from two separate observations. The spectrum shows a prominent 6.4 keV line that is resolved, meaning that the measured width of the line is greater than the instrument’s resolution limit. Additionally, the line cannot be fit with a single emission line and instead requires multiple lines, signaling multiple physical scales contributing to this emission line. The right panels of this figure highlight that there are three distinct components to this emission line with broad (magenta), intermediate (dark blue), and narrow (cyan) widths. Since gas that is closer to the black hole will be moving faster than more distant gas, the authors can use these line widths to estimate where this gas is located. They find that these three lines range from about 100 gravitational radii (about 100 times the size of the black hole) to about 10,000 gravitational radii. Determining the multi-scale nature of this line has been extraordinarily difficult to detect with other instruments due to their limited energy resolution!
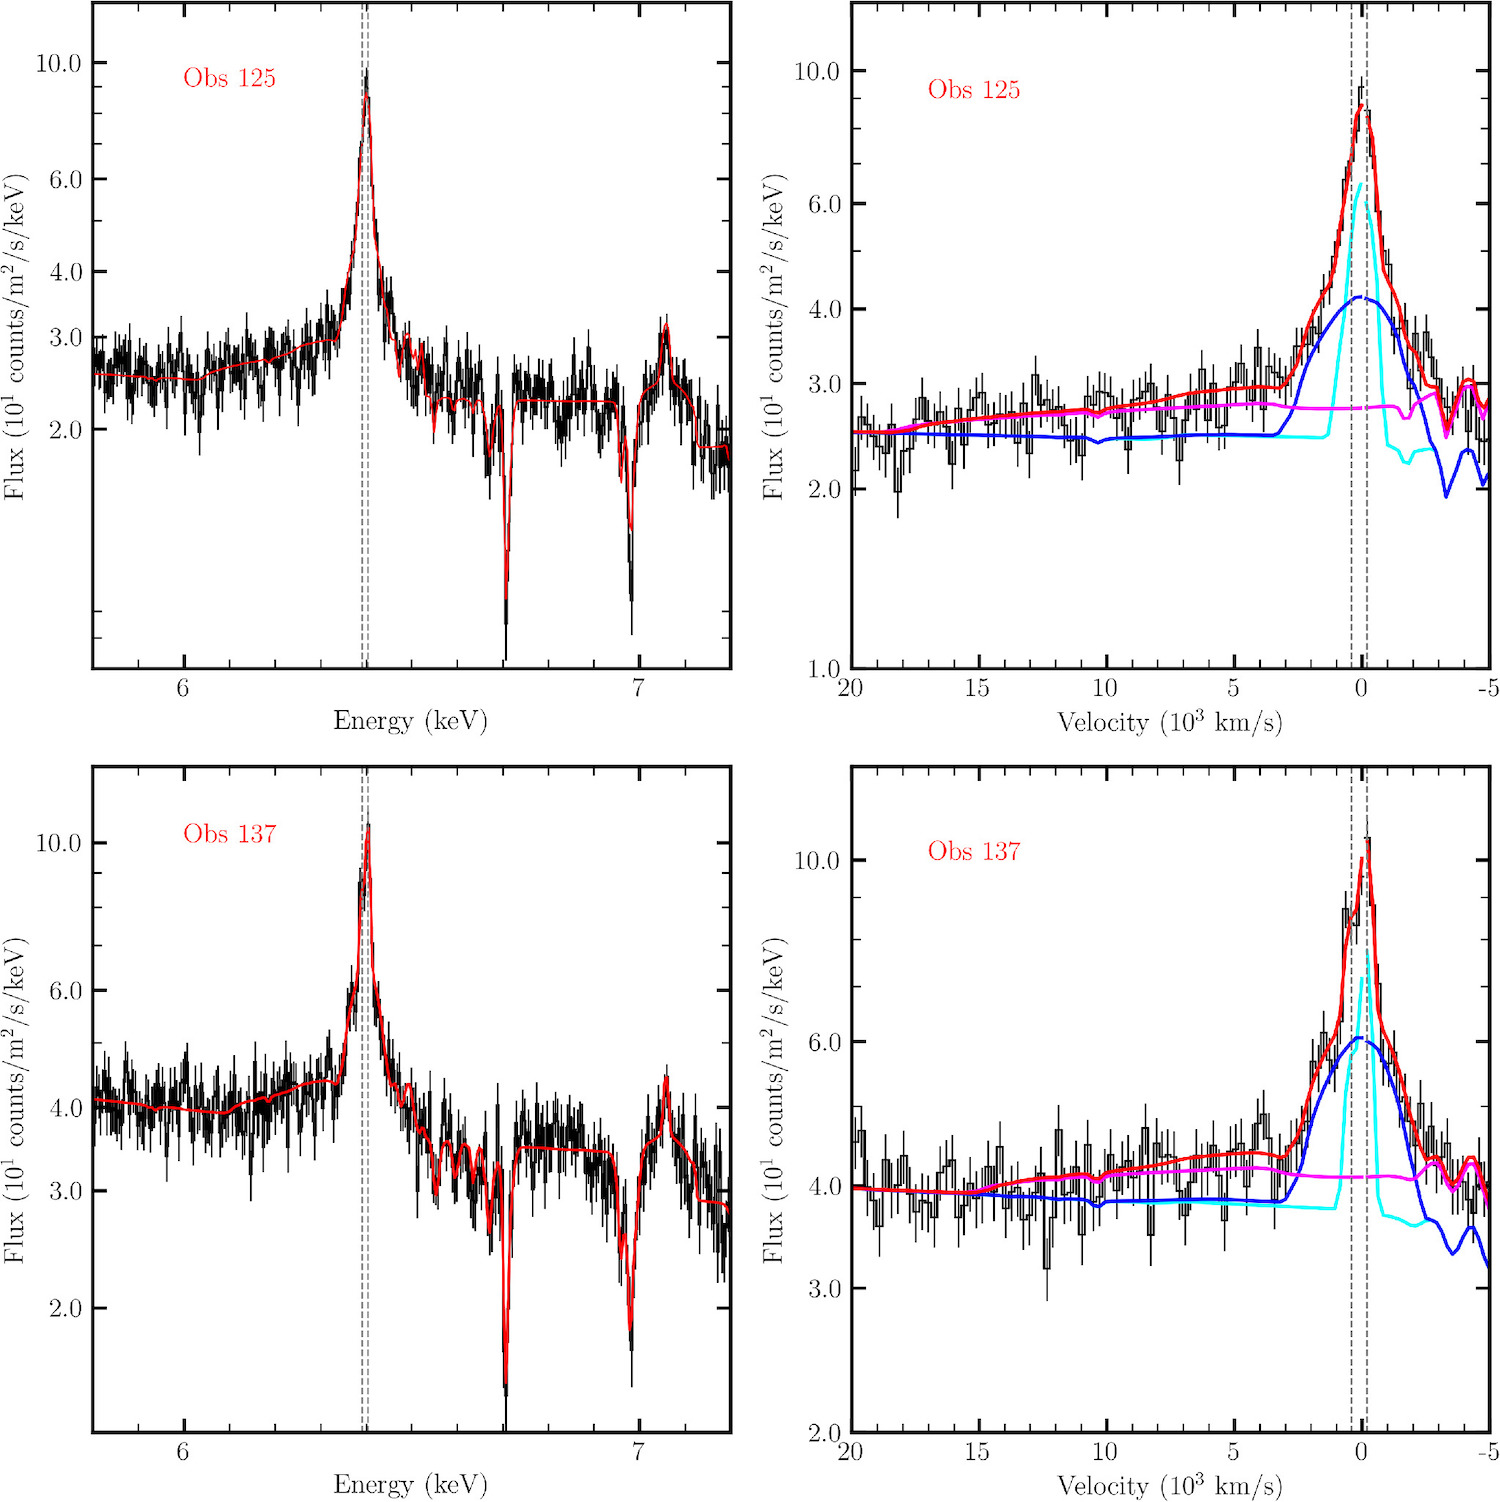
Figure 2: XRISM Resolve spectra of NGC 4151. The left panels show the spectrum in the 5.8-7.2 keV range from two separate observations, with the data in black and the best fit total model in red. The right panels show a zoom in on the iron Kα 6.4 keV line with the three different components for the line also shown. The magenta model corresponds to the widest line, arising potentially from a warped disk, the dark blue model corresponds to the intermediate width line coming from the inner edge of the broad line region (BLR), and the cyan model corresponds to the most narrow line that arises from the inner edge of the dusty torus. [XRISM Collaboration et al. 2024]
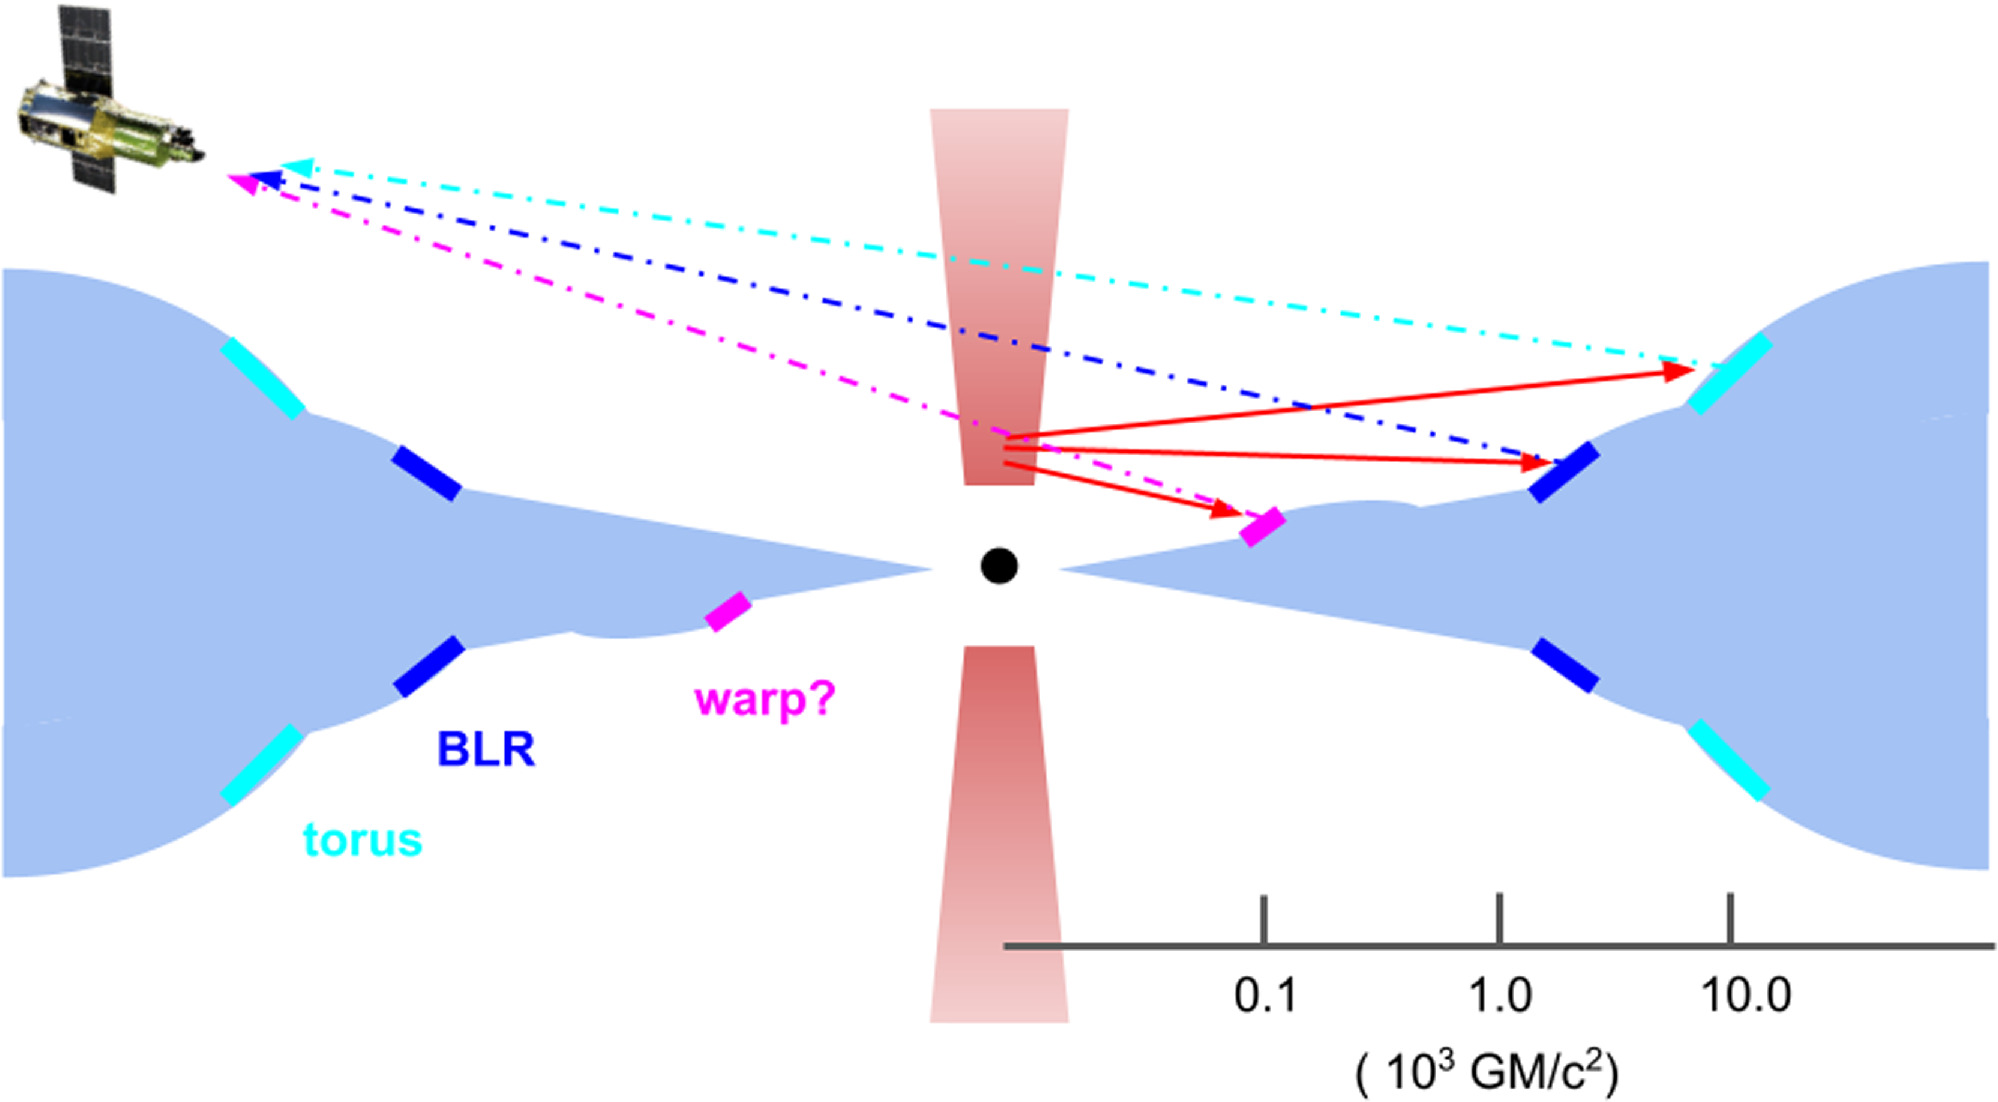
Figure 3: Schematic highlighting where each of the iron Kα emission lines arise from. The magenta component corresponds to the broadest line, potentially from a warp in the disk. The dark blue component corresponds to the intermediate-width line and arises from the inner edge of the broad line region (BLR). The cyan component corresponds to the narrowest line and arises from the inner edge of the active galactic nucleus torus. [XRISM Collaboration et al. 2024]
What’s Next?
These XRISM observations are rich with information, and today’s article focused only on the 6.4 keV emission line. The authors are planning a series of further articles, including on the active galactic nucleus winds traced by the absorption lines (i.e., the major dips seen at ~6.7 and ~7 keV in the left panels of Figure 2), comparisons of the emission lines with optical emission lines, and looking for faint evidence of broader emission from even closer to the supermassive black hole. The next obvious steps are also to observe more active galactic nuclei to test whether this multi-zone emission is a common occurrence in active galactic nuclei. One thing’s for sure, this 20/20 vision is sure to reveal new secrets about the lives and environments of supermassive black holes!
Original astrobite edited by Roel Lefever.
About the author, Megan Masterson:
I’m a 4th-year PhD student at MIT studying transient accretion events around supermassive black holes, including tidal disruption events and changing-look active galactic nuclei. I primarily use multi-wavelength observations to study from the inner accretion flow to the obscuring material in these transients. In my free time, you’ll find me hiking, reading, and watching women’s soccer.