
Editor’s Note: Astrobites is a graduate-student-run organization that digests astrophysical literature for undergraduate students. As part of the partnership between the AAS and astrobites, we occasionally repost astrobites content here at AAS Nova. We hope you enjoy this post from astrobites; the original can be viewed at astrobites.org.
Title: Exploring Changing-Look Active Galactic Nuclei with the Sloan Digital Sky Survey V: First Year Results
Authors: Grisha Zeltyn et al.
First Author’s Institution: Tel Aviv University
Status: Published in ApJ
Challenging the Original Picture
Supermassive black holes are among the most powerful objects in the universe. Those that are accreting gas from their surroundings (called active galactic nuclei, or AGN for short) release an enormous amount of energy back to their surroundings — enough to unbind an entire galaxy! Historically, AGN have been classified by the emission lines in their optical spectra: Type 1 AGN show broad emission lines, especially from the Balmer series of hydrogen, whereas Type 2 AGN do not show broad emission lines (see this Astrobite for details on the different classifications). As early as the late 1980s/early 1990s, it was hypothesized that these two classifications could be unified into a single model, where the difference in AGN optical spectra was related to the viewing angle to the nucleus. In this model, broad emission lines can only be seen if the observer is seeing the AGN nearly face-on, whereas these lines tend not to be seen in edge-on systems where the observer is probably looking through dense clouds of gas and dust called the torus (see this Astrobite for more on the dusty torus).
This view is supported by the existence of Type 2 AGN with broad emission lines in their polarized spectra. These spectra only contain polarized light, which can contain emission from the broad lines being scattered off of the gas and dust. However, recently there have been a subset of AGN that show changes between these different spectral types on timescales of months to decades. This new class is called “changing-look” AGN, and they challenge the idea that the viewing angle alone determines the type of AGN you see. An example of a changing-look AGN (newly found in today’s article) is shown in Figure 1. The black spectrum was taken 20 years after the blue one and clearly shows a newly formed broad Hβ line as well as an increasingly strong Hα line.

Figure 1: Example of a changing-look AGN spectrum. The blue spectrum shows the original spectrum from 2002, and the other spectra are from 2021–2022, where there is now a strong, broad Hβ line and a blue continuum. [Adapted from Zeltyn et al. 2024]
Introducing: Changing-Look AGN in SDSS-V
Detecting changing-look AGN is difficult because the changes occur on relatively long timescales and require multiple optical spectra of the same AGN (which is rather rare to have!). However, no need to fear, today’s article is here! The authors of today’s article present one of the first systematic searches for changing-look AGN using a new survey, the Black Hole Mapper program as part of SDSS-V, the fifth generation of the Sloan Digital Sky Survey. This survey was designed to take numerous optical spectra of hundreds of thousands of AGN. Today’s article focuses on the first year of data, which contains almost 30,000 AGN with multiple optical spectra. From this sample, the authors find 116 changing-look AGN that vary on timescales ranging from 2 months to 19 years!
It’s All About the Rate!
By comparing their new, robust sample of changing-look AGN to a control sample of ordinary AGN, the authors investigated if there were any crucial differences between the two samples that could help illuminate the origin of changing-look AGN. They found that the black hole mass and total energy output were not significantly different between the two samples, but the accretion rate normalized to the black hole mass (also known as the Eddington ratio) was different. This is shown in Figure 2, with the red showing the changing-look AGN and the blue showing the control sample of ordinary AGN. The two different panels show different control samples, but importantly, they both show this same exact trend. This confirms what other studies have suggested — that the most important factor for determining whether an AGN will undergo a changing-look event is its relative accretion rate!
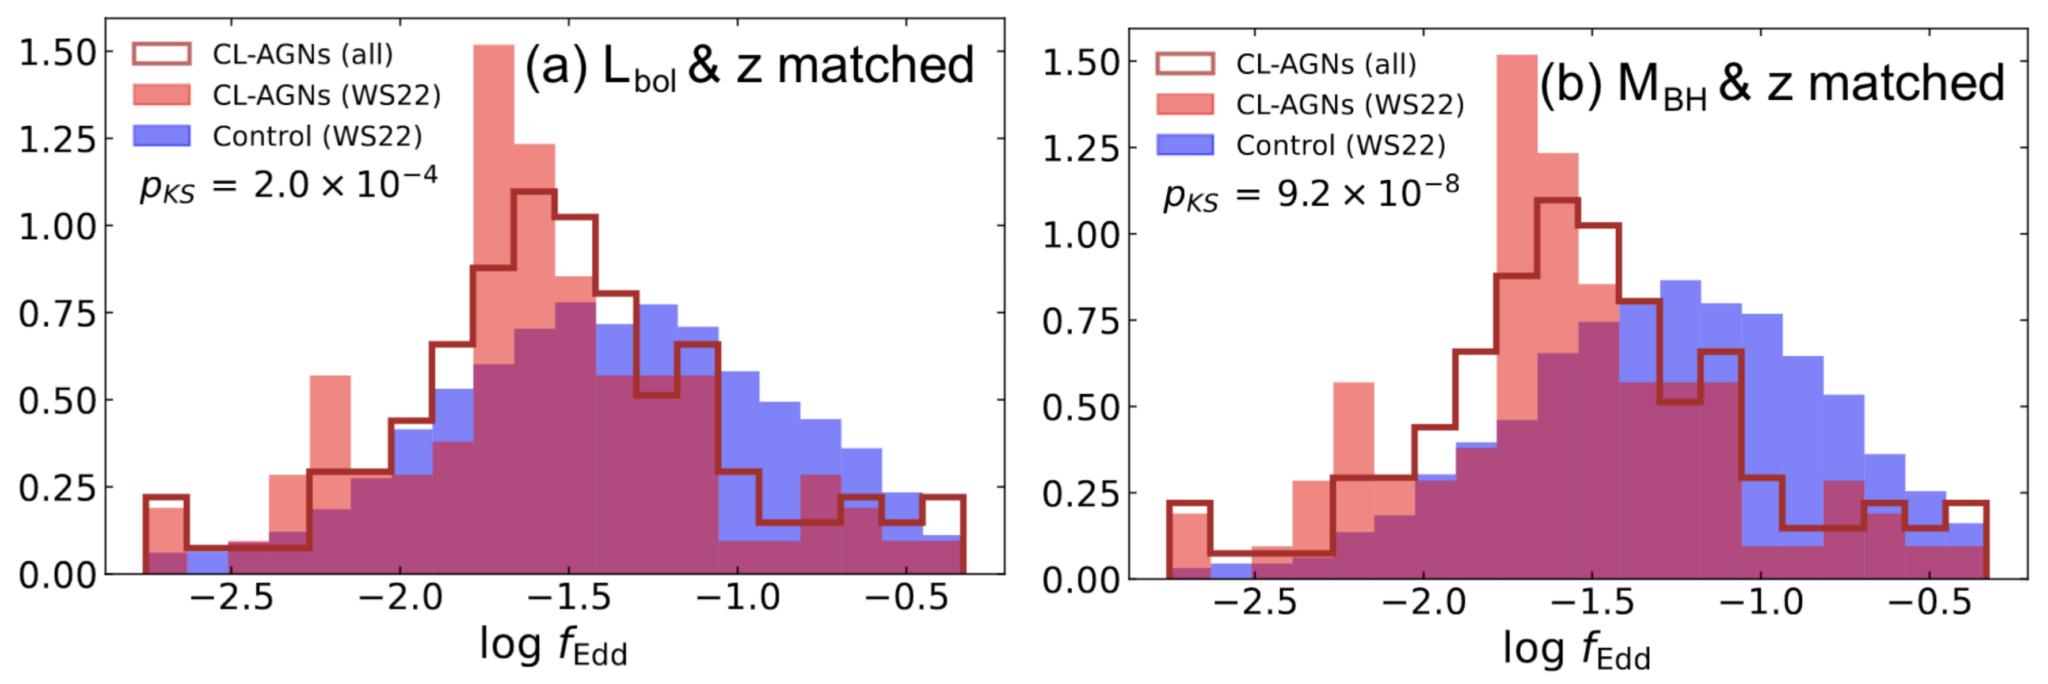
Figure 2: Comparison of the Eddington ratio (the accretion rate normalized to the black hole mass) of ordinary AGN (blue) and changing-look AGN (red). The ordinary AGN (control sample) are drawn from a past research article and are matched to other quantities — the bolometric luminosity (left) and black hole mass (right) — of the changing-look AGN to control against. The changing-look AGN show a statistically lower Eddington ratio than both control samples. [Adapted from Zeltyn et al. 2024]
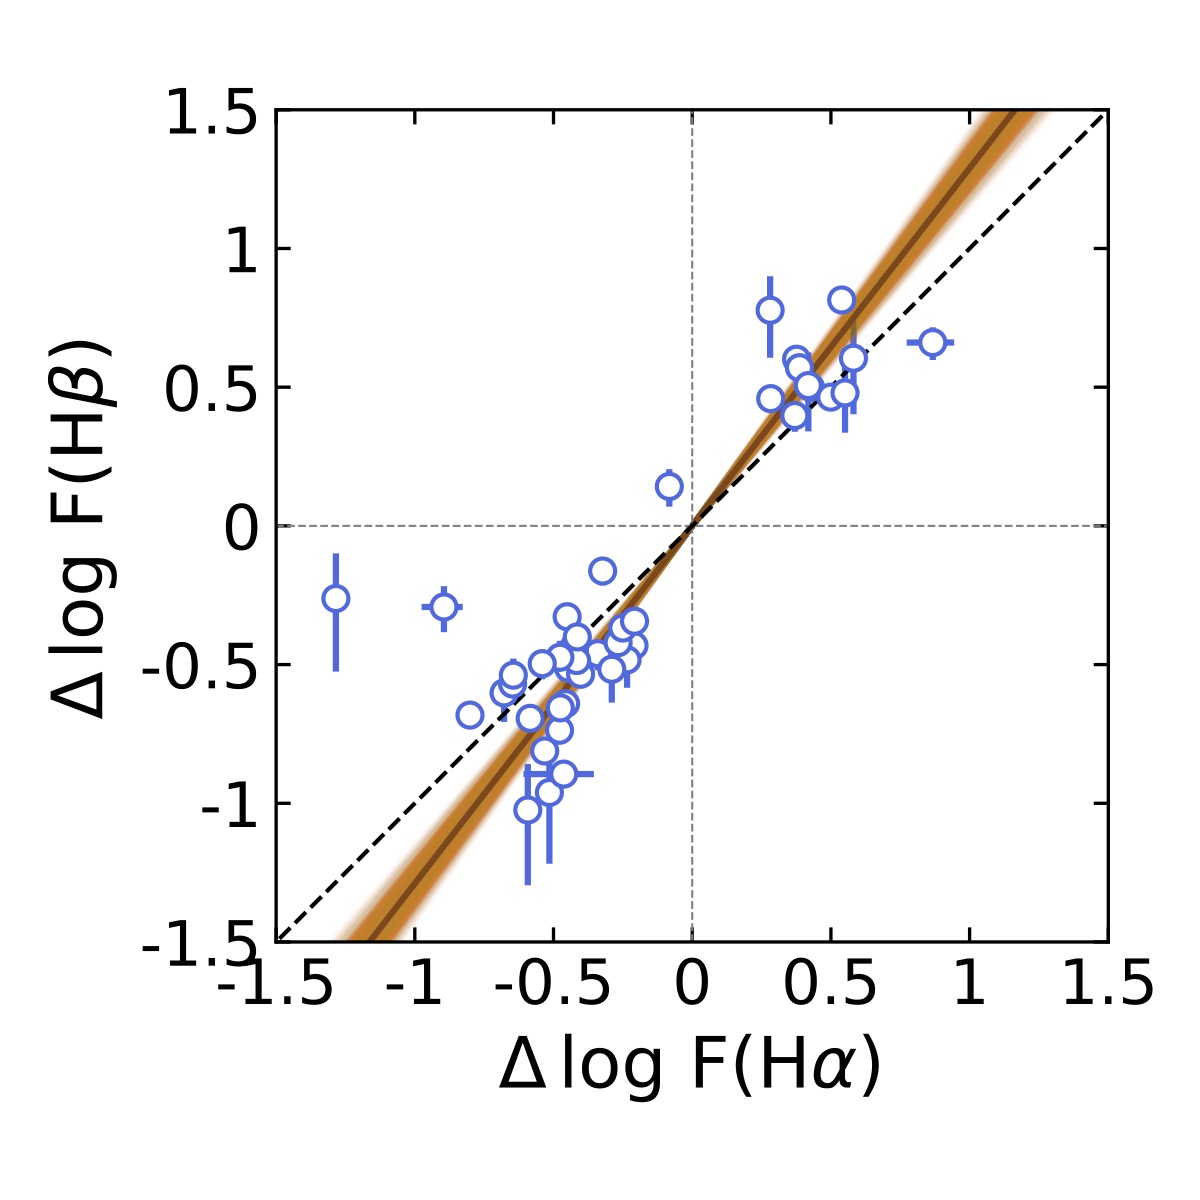
Figure 3: Comparing the relative change in the Hα and Hβ lines for AGN where both can be observed. The two are positively correlated, which is expected, but the Hβ lines seem to vary more than the Hα on average. This could indicate that the observed changes are due to some alterations to the gas and dust along our sight line to the supermassive black hole. [Adapted from Zeltyn et al. 2024]
Wondering how these cosmic curiosities fit into the grand picture of AGN? Keep your eyes peeled because this is coming next! The authors stress that continued SDSS-V/Black Hole Mapper observations will lead to larger samples of changing-look AGN and will help us better understand how these changing-look events relate to normal AGN variability.
Original astrobite edited by Janette Suherli.
About the author, Megan Masterson:
I’m a 4th-year PhD student at MIT studying transient accretion events around supermassive black holes, including tidal disruption events and changing-look active galactic nuclei. I primarily use multi-wavelength observations to study from the inner accretion flow to the obscuring material in these transients. In my free time, you’ll find me hiking, reading, and watching women’s soccer.