
Editor’s Note: Astrobites is a graduate-student-run organization that digests astrophysical literature for undergraduate students. As part of the partnership between the AAS and astrobites, we occasionally repost astrobites content here at AAS Nova. We hope you enjoy this post from astrobites; the original can be viewed at astrobites.org.
Title: UV and Lyα Halos of Lyα Emitters across Environments at z = 2.84
Authors: Satoshi Kikuta et al.
First Author’s Institution: National Astronomical Observatory of Japan and University of Tsukuba
Status: Published in ApJ
Astrophysics is an observational science. At its most basic level, the science we do requires light from the object we’re studying to reach our telescopes. If the light is produced only at a specific wavelength, as is the case for a spectral line, that’s even better, because it can be used to probe the properties of the object we’re trying to study in detail.
A Useful Escapee
Hydrogen, which is the most common atom in galaxies (and in the universe as a whole, by a lot), produces several spectral lines. The one we’re looking at today is produced by an electron transitioning from its first excited state down to its lowest-energy state. This is known as the hydrogen Lyman-alpha (Lyα) transition, and it produces light in the ultraviolet range at a wavelength of 121.6 nanometers in its rest frame. If the transition happens far enough away, however, the expansion of the universe redshifts the light to longer wavelengths in the visible range. Because there’s so much hydrogen in galaxies, this spectral line is very bright, and because many modern-day telescopes are designed to capture visible light, this line is very easy to see.
Let Me OUTTTTT
Based on all this, Lyα should be the perfect type of light to use when studying galaxies! There’s one issue, however — that light still has to reach the telescope. This is harder than it sounds, for the same reason that so much Lyα emission is produced by galaxies in the first place. Hydrogen is very, very common in galaxies, and hydrogen atoms can suck the Lyα light back up (absorb it) just as easily as they emit it in the first place. Because hydrogen is so common, Lyα light has to rattle around for a long time, being absorbed and re-emitted, before it can finally escape the galaxy in which it was produced. This means that by the time it reaches our telescopes, Lyα light isn’t a great tracer of the regions where it was emitted, but it is a very good tracer of the size and shape of the hydrogen gas across the entire galaxy.
Some Very Efficient Observations
In today’s article, the authors investigate a resolved image of the Lyα emission from a still-forming cluster of galaxies at redshift z = 2.84 (light that was emitted 11.4 billion years ago). Because so many galaxies are clumped together in this galaxy cluster, the 3,490 Lyman-alpha-emitting galaxies in the image could all be observed in just 8.5 hours with the Hyper-Supreme Cam on the Subaru telescope. Observations used the g-band optical filter (which shows redshifted ultraviolet emission) and a narrowband filter intended to pick up emission exclusively from the Lyα spectral line. All of the Lyman-alpha-emitting galaxies detected in the image are shown in Figure 1, colored by their equivalent width, which is a measure of the strength of the emission. The dense region at the center of the image contains an extremely bright quasi-stellar object (QSO; a galaxy with a black hole in its center sucking up matter so fast that the matter becomes brighter than the galaxy itself), which is how the cluster was discovered in the first place.
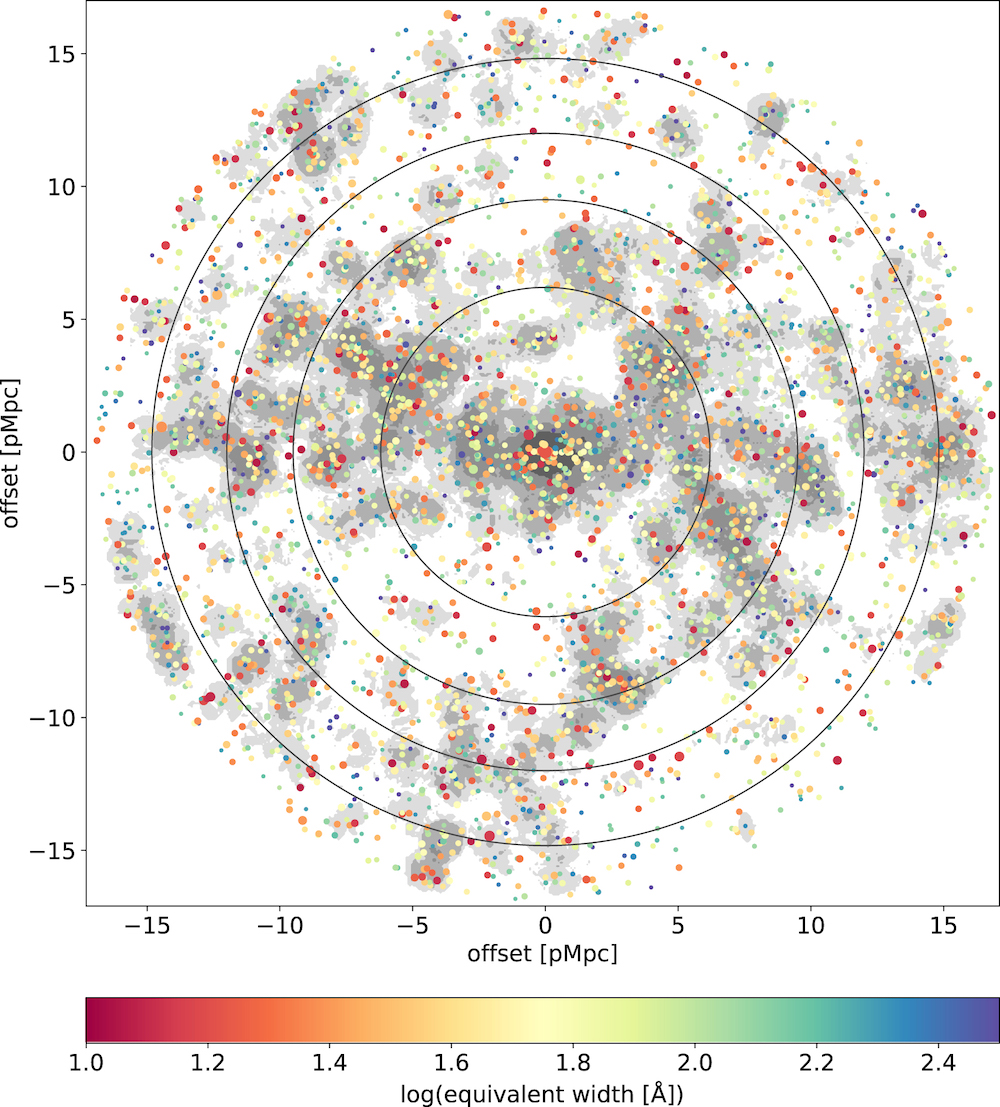
Figure 1: The positions on the sky of the 3,490 Lyman-alpha-emitting galaxies being studied in today’s article. The points are colored by the strength of the Lyα emission from each galaxy, and their size corresponds to the strength of each galaxy’s ultraviolet emission. The gray contours show the regions where the galaxies are most densely grouped together. [Kikuta et al. 2023]
Stacking Up the Evidence
The authors of this article wanted to investigate how various galaxy properties change the way Lyα photons escape from a galaxy. To do this, they split the full sample of Lyman-alpha-emitting galaxies into subsamples based on other galaxy properties, such as the luminosity of the Lyα and ultraviolet emission, the equivalent width of the Lyα line, or the distance between the galaxy and the central QSO. They then stacked together the images of all the galaxies in each subsample to produce a single average image with a much better signal-to-noise ratio for each subsample. From these averaged images, shown in Figure 2, the authors can calculate the amount of Lyα emission as a function of distance from the center (a radial profile, like the ones shown in Figure 3) to calculate the average size and shape of the Lyα emission from the included galaxies. They can thus deduce how Lyα escape is affected by the galaxy properties that change between subsamples.
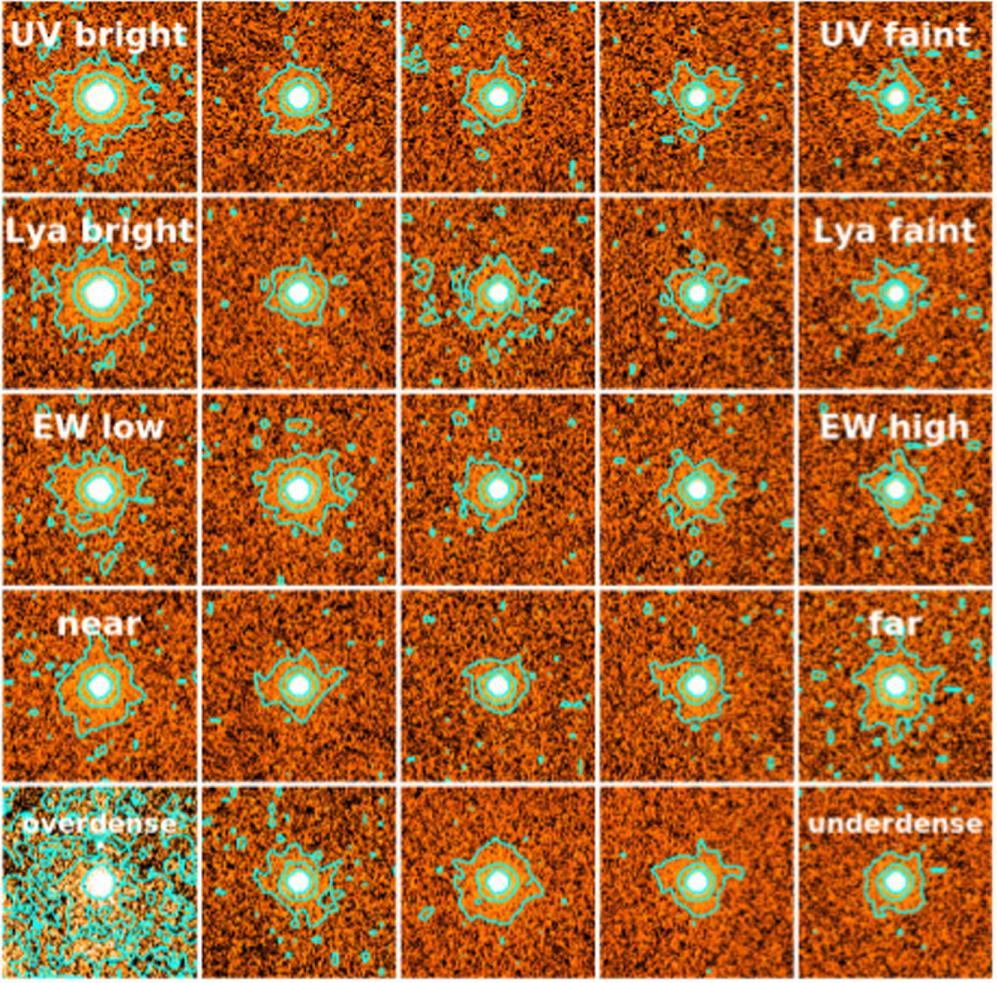
Figure 2: Stacked images of the Lyα emission from the subsamples of Lyman-alpha-emitting galaxies defined by the authors to explore the effects of various galaxy properties on Lyα emission. From top to bottom, the subsamples are split based on: the magnitude of the ultraviolet emission, the Lyα luminosity, the Lyα equivalent width, and the distance from the central QSO. Contours are provided to show the Lyα shape more clearly. [Adapted from Kikuta et al. 2023]
Factors Affecting Escape
The authors found that Lyα escape matched their expectations well in general: galaxies with more ultraviolet or Lyα luminosity, or with lower equivalent widths (all indicators that a galaxy is making new stars quickly), had much more extended Lyα emission than their lower-luminosity counterparts. This makes sense — bigger galaxies form more stars, so the ones forming stars the fastest should have the most extended hydrogen gas, and thus the most extended Lyα emission.
Trends in the subsamples split up by the galaxy’s environment, however, weren’t quite so well behaved. The size of the Lyα emission didn’t change much as the galaxies got more distant from the central QSO, but the shape (the spatial distribution) of the emission definitely did. Galaxies far from the QSO had a lot of Lyα escape in the center of the galaxy, but the amount dropped off very fast towards the outskirts (the blue and green lines in Figure 3). Galaxies close to the QSO, however, didn’t have as steep a drop-off (the red line in Figure 3).
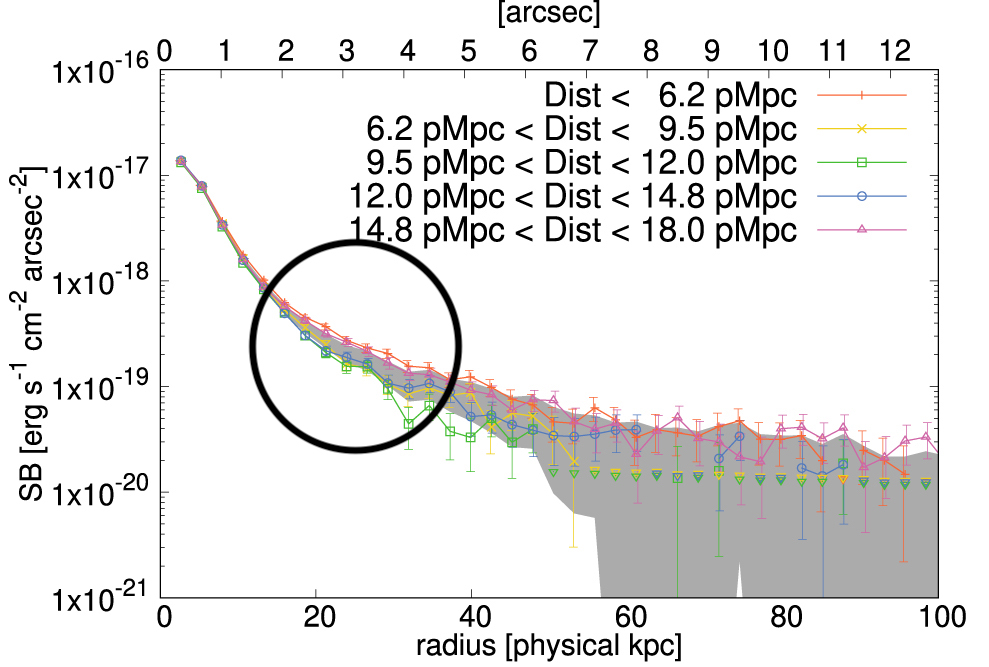
Figure 3: The average radial profiles (amount of emission as a function of distance from the center) of the different subsamples, split based on distance from the QSO. Note that, in the circled region, there’s more emission from the close-in galaxies (the red line) than the distant ones (the blue and green lines). [Adapted from Kikuta et al. 2023]
What’s Next?
High-redshift protoclusters like the one studied here are very important to understanding galaxy evolution, because they will evolve into galaxy clusters like the one we live in now. They are very difficult to study effectively, however, because they’re so far away. It’s therefore critical to develop techniques like the one being used by the authors here, that study many galaxies at once using a minimum amount of telescope time. In the future, the authors plan to do similar analyses on different clusters using different telescopes (such as JWST) to really nail down the factors affecting Lyα escape.
Original astrobite edited by Karthik Yadavalli.
About the author, Delaney Dunne:
I’m a PhD student at Caltech, where I study how galaxies form and evolve by mapping their molecular gas! I do this using COMAP, a radio-frequency Line Intensity Mapping experiment based in California’s Owens Valley.