
Editor’s Note: Astrobites is a graduate-student-run organization that digests astrophysical literature for undergraduate students. As part of the partnership between the AAS and astrobites, we occasionally repost astrobites content here at AAS Nova. We hope you enjoy this post from astrobites; the original can be viewed at astrobites.org.
Title: Pegasus W: An Ultra-Faint Dwarf Galaxy Outside the Halo of M31 Not Quenched by Reionization
Authors: Kristen B. McQuinn et al.
First Author’s Institution: Rutgers University
Status: Published in ApJ
Our local patch of the universe is populated by a number of galaxies — the so-called “Local Group,” consisting of our very own Milky Way, the similar-in-mass Andromeda Galaxy (Messier 31), and between 50 and 100 known “dwarf” or low-mass galaxies. The faintest, least massive of these, termed ultra-faint dwarfs, range in mass from a few thousand solar masses down to just a few hundred solar masses! Ultra-faint dwarfs in the Local Group are of immense interest to astronomers, since they can be used to study a variety of phenomena ranging from dark matter dynamics to stellar feedback, and from chemical evolution to ram pressure stripping. Owing to the low mass and weak gravitational potentials of ultra-faint dwarfs, these various physical processes often have outsize effects on their stars and gas, making them ideal objects for study.
Today’s authors report the discovery of a new ultra-faint dwarf named Pegasus W and analyse some of its interesting properties. Most ultra-faint dwarfs are extremely difficult to detect as they are faint and often diffuse — in fact, looking at a simple image of one may not even reveal its presence, as Figure 1 shows! Therefore, they are often detected by looking for statistical overdensities of stars in large sky surveys, and that’s exactly how Pegasus W was discovered from Dark Energy Spectroscopic Instrument (DESI) data. The authors of today’s article then followed up with Hubble Space Telescope imaging to study the stellar populations in the galaxy.
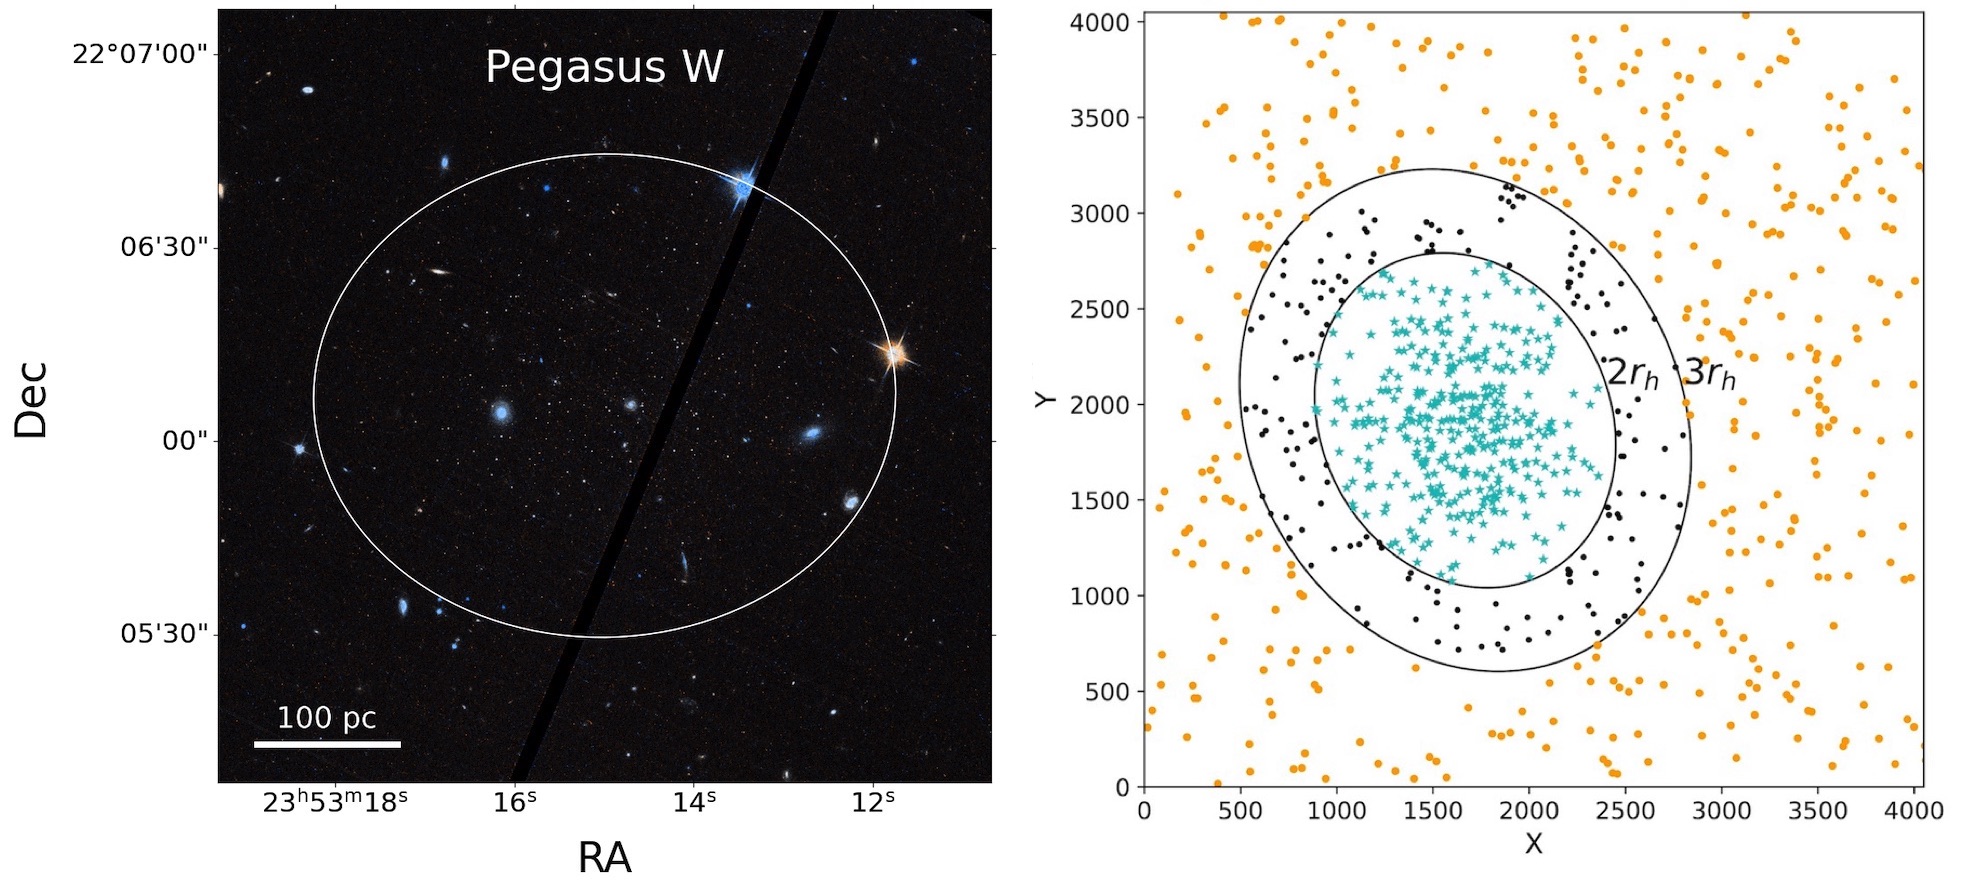
Figure 1: Left-hand panel shows a Hubble Space Telescope image of the area of the sky where Pegasus W is located. The right panel shows a view of the stellar density distribution, with the contours highlighting the over-density of stars that indicates the presence of Pegasus W. [Adapted from McQuinn et al. 2023]
One of the most important properties of a galaxy is its star formation history — a fossil record of how it assembled and grew over time. Local Group dwarf galaxies are especially well suited for star formation history studies because of how nearby they are. The Local Group is the only place in the entire universe where we can get resolved photometry (imaging) of the individual stars in a galaxy, whereas for all other galaxies farther away we can only observe their starlight as an unresolved blob! This is key for measuring accurate star formation histories, since resolved stellar imaging allows us to build a colour–magnitude diagram for a galaxy — a plot of all its stars comparing their luminosities to their temperatures. After constructing a galaxy’s colour–magnitude diagram, we can fit stellar evolution models to it to figure out how old its various stellar populations are, and this allows us to reverse-engineer the entire record of how it formed its stars over cosmic time!
Figure 2 shows how this analysis was carried out for Pegasus W. The top-left panel shows the observed colour–magnitude diagram for the galaxy, with the top right being the best-fit diagram from stellar evolution modelling. The bottom left shows the residuals (i.e., what results from subtracting the model from the data). The residual significance diagram on the bottom right shows a checkerboard pattern, which indicates that the model is a good fit.
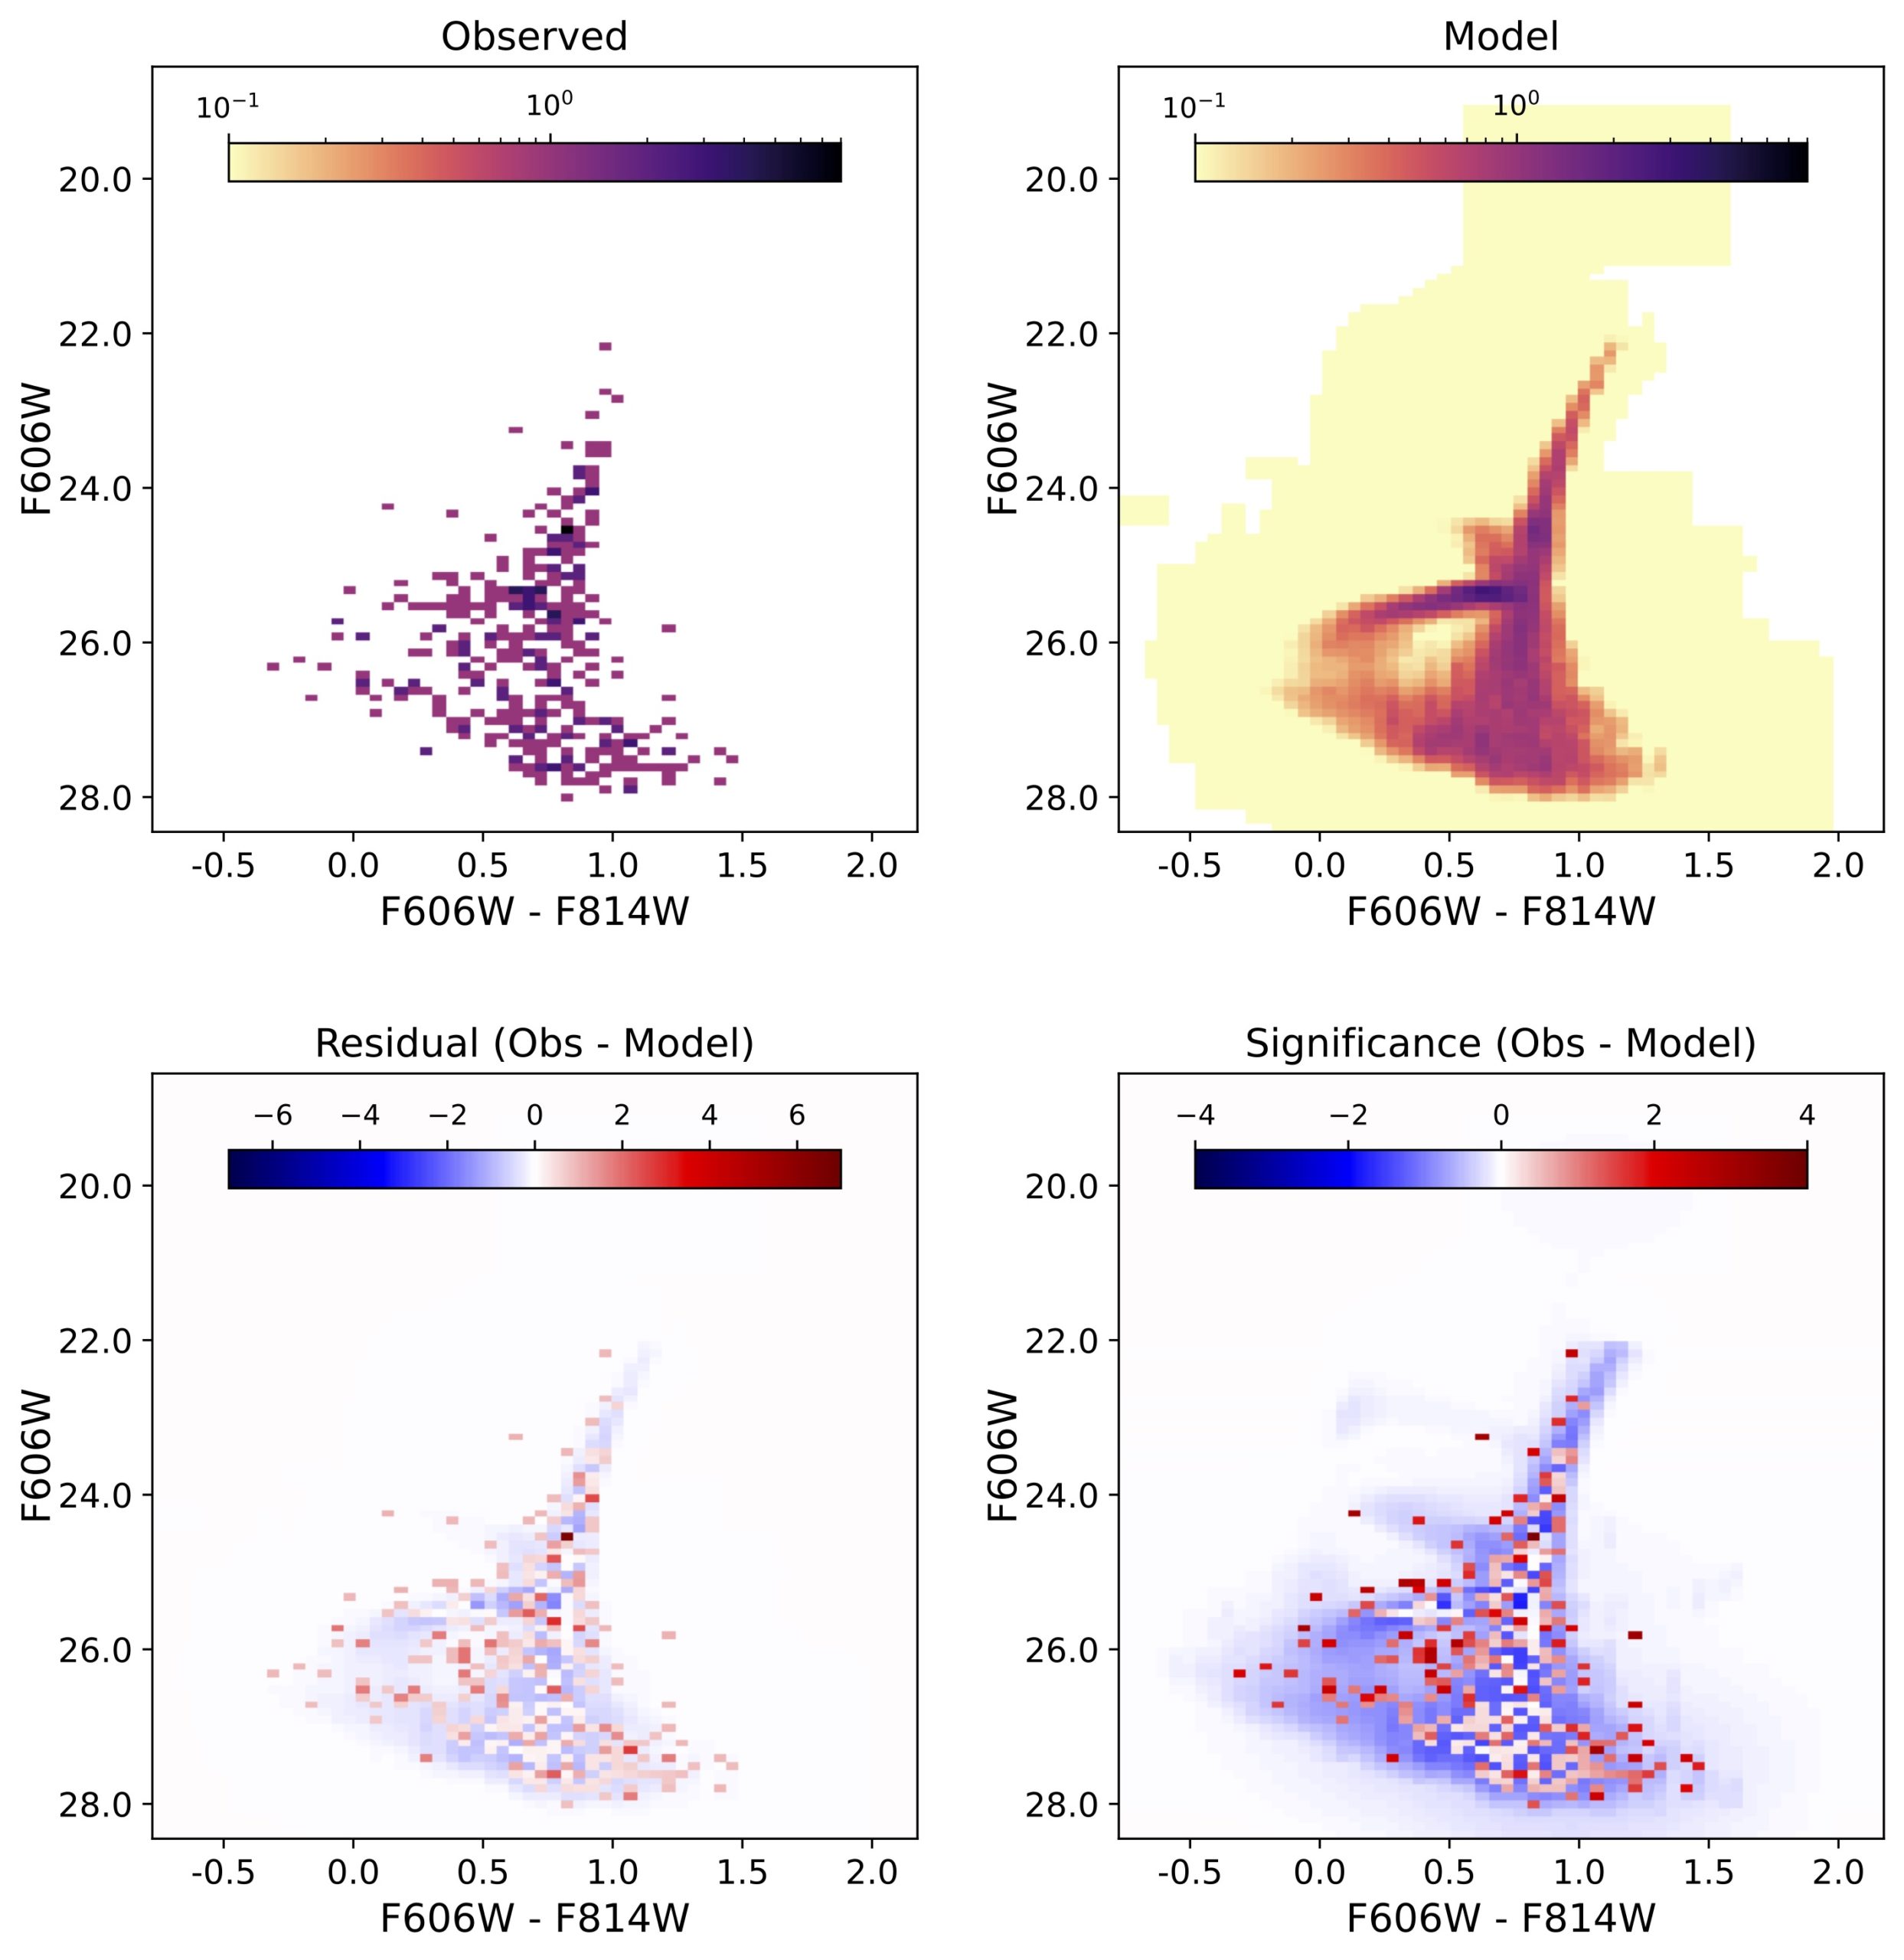
Figure 2: Top left: Observed colour–magnitude diagram for Pegasus W from resolved stellar imaging. Top right: Colour–magnitude diagram reconstruction using stellar evolution models. Bottom left: Residual resulting from subtracting the model from the data. Bottom right: Residual significance diagram showing that the model is a good fit. [McQuinn et al. 2023]
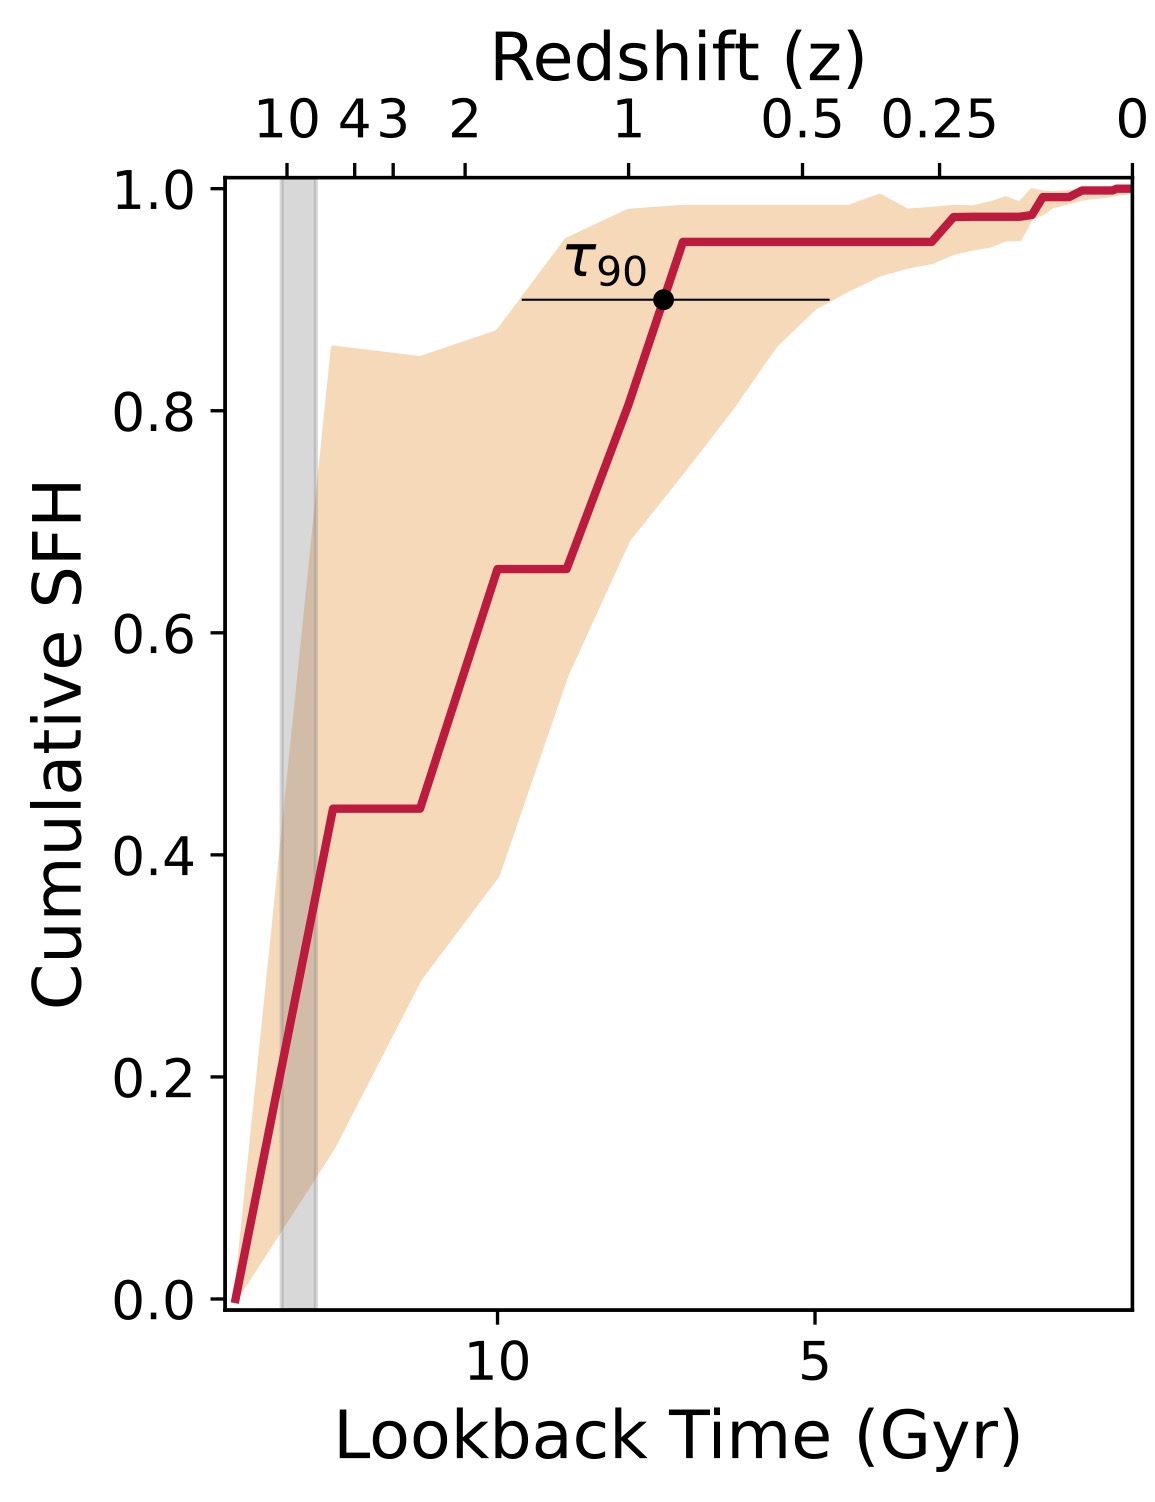
Figure 3: Star formation history for Pegasus W, showing the fraction of its present-day stellar mass at various points in time from the Big Bang (left-hand edge) to present day (right-hand edge). The orange shaded region represents the error on the star formation history, while the grey shaded region represents the epoch of reionisation. [McQuinn et al. 2023]
The puzzle of Pegasus W’s star formation history is likely to generate significant debate amongst astronomers studying galaxy evolution and reionisation. The authors note that better photometric data and perhaps even spectroscopy would help improve the uncertainty on the star formation history measurements, and that JWST is likely to help shed more light on this mystery in coming years.
Original astrobite edited by Isabella Trierweiler.
About the author, Pratik Gandhi:
I’m a 3rd-year astrophysics PhD student at UC Davis, originally from Mumbai, India. I study galaxy formation and evolution, and am really excited about the use of both simulations and observations in the study of galaxies. I am interested in science communication, teaching, and social issues in academia. Also a huge fan of Star Trek, with Deep Space Nine and The Next Generation being my favourites!