
Editor’s Note: Astrobites is a graduate-student-run organization that digests astrophysical literature for undergraduate students. As part of the partnership between the AAS and astrobites, we occasionally repost astrobites content here at AAS Nova. We hope you enjoy this post from astrobites; the original can be viewed at astrobites.org.
Title: The Panchromatic Hubble Andromeda Treasury: Triangulum Extended Region (PHATTER) II. The Spatially Resolved Recent Star Formation History of M33
Authors: Margaret Lazzarini et al.
First Author’s Institution: California Institute of Technology
Status: Published in ApJ
The Panchromatic Hubble Andromeda Treasury (PHAT) team has already done the impossible. Led by Professor Julianne Dalcanton (read our interview with her from #AAS233 here!), PHAT completely revolutionized observational astronomy by imaging over 117 million stars in the disk of the Andromeda Galaxy, otherwise known as Messier 31. Imaging Messier 31 took two weeks of Hubble Space Telescope time, which is a remarkable achievement considering many observational astronomers are lucky to get even a few precious hours on Hubble!
Now, the PHAT team is ready for round two. They have moved on to Messier 31’s neighbor and the third most massive galaxy in our Local Group: the Triangulum Galaxy, or Messier 33. And of course, this observing program wouldn’t be complete without a new, catchy acronym: the Panchromatic Hubble Andromeda Treasury: Triangulum Extended Region, or “PHATTER.” Studying Messier 33 in addition to Messier 31 is beneficial because Messier 33 has had more star formation overall and can therefore provide more insight into a new parameter space previously unexplored in Messier 31. Messier 33 also has a lower stellar surface density (i.e., lower star-to-area ratio), so resolving individual stars is much easier in Messier 33 than in Messier 31. The PHATTER team has generously made their data publicly available, providing photometry (i.e., the measured flux from astronomical objects) for over 22 million stars covering 38 square kiloparsecs (about 400 million square light-years) of Messier 33.
This article, the second in the PHATTER series (where the first described the observations and photometry), measured the star formation history of Messier 33. Measuring the star formation history of a galaxy can provide crucial information about the astrophysical phenomena that shape galaxy formation, such as how the structure of a galaxy changes over time.
To measure star formation rates of galaxies, astronomers have historically used two different methods. The first method involves studying ultraviolet emission from massive young stars. Because young stars primarily emit at ultraviolet wavelengths, ultraviolet flux is often used as a tracer for star formation within the last 200 million years. The second method involves studying H-alpha emission, which occurs when the electron in a hydrogen atom falls from the third energy level to the second. H-alpha emission often indicates that hydrogen is being ionized, usually by young O stars, and this emission traces star formation within the last 5 million years. However, both of these techniques are limited by dust extinction, which can be difficult to correct for.
The authors of today’s article use a novel method referred to as “CMD-based modeling” to measure the star formation history of Messier 33. The basic premise of this technique is that if you have high-accuracy photometry, you can use color–magnitude diagrams (CMDs, the observer’s version of the H-R diagram, where instead of plotting luminosity vs. temperature, you plot magnitude vs. color) to infer the star formation rates throughout history that would have produced a given observed population of stars. For example, younger stars spend less time in a given color–magnitude diagram zone than older red giant branch stars, and this information can be used to interpret the observed color–magnitude distribution of stars in a galaxy. Another useful benefit of the CMD-based modeling technique is that it simultaneously fits for the dust extinction, unlike the ultraviolet or H-alpha methods.
To measure the star formation history in bins across the face of Messier 33, the authors split their photometry into ~2,000 regions, each of which contained 4,000 stars on average. To measure the star formation history, the team fit color–magnitude diagrams in each region using the MATCH software, which finds the combination of stellar populations that best produces the observed color–magnitude diagram. Using this software, the authors were able to reconstruct Messier 33’s star formation history by measuring the star formation rate in ~50-million-year bins, up until 630 million years ago. While the CMD-based method requires high-resolution photometry, you can study the star formation rate throughout history, whereas the ultraviolet and H-alpha techniques only measure recent star formation.
The Structure of Messier 33
Detailed star formation histories can be used to measure how a galaxy’s stellar structure has changed over time. Messier 33 has typically been characterized as a flocculent spiral galaxy, meaning its spiral arms are less defined than those of a grand design spiral galaxy like Messier 101 (see Figure 1 for a comparison of the two). However, by studying the star formation rate throughout Messier 33’s history (as opposed to just the recent star formation), the authors were able to reconstruct the evolution of Messier 33’s spiral structure using the measured star formation rate in ~50-million-year time bins.

Figure 1: A flocculent spiral galaxy like Messier 33 (left) versus a grand design spiral galaxy like Messier 101 (right). Flocculent or “fluffy” spiral galaxies have less well-defined spiral arms than grand design spiral galaxies. [Left: NASA, ESA, and M. Durbin, J. Dalcanton and B. F. Williams (University of Washington); right: Hubble Image: NASA, ESA, K. Kuntz (JHU), F. Bresolin (University of Hawaii), J. Trauger (Jet Propulsion Lab), J. Mould (NOAO), Y.-H. Chu (University of Illinois, Urbana) and STScI; CFHT Image: Canada-France-Hawaii Telescope/J.-C. Cuillandre/Coelum; NOAO Image: G. Jacoby, B. Bohannan, M. Hanna/NOAO/AURA/NSF]
In Figure 2, you can clearly see the split between these two stellar populations. The authors also clearly detect a bar in Messier 33 that is older than about 79 million years, which is significant because there has been a lot of recent debate in the literature about whether Messier 33 has a bar. The detection of bars in galaxies has strong implications for the galaxy formation history; bars force a lot of gas towards the galaxy’s center, fueling new star formation, building central bulges of stars, and feeding massive black holes. In particular for Messier 33, a small bar could explain discrepancies between models and observed gas velocities in the inner disk. The authors suggest that more modeling should be done to explain why the younger stellar populations did not form in a bar, whereas the older stellar populations did.
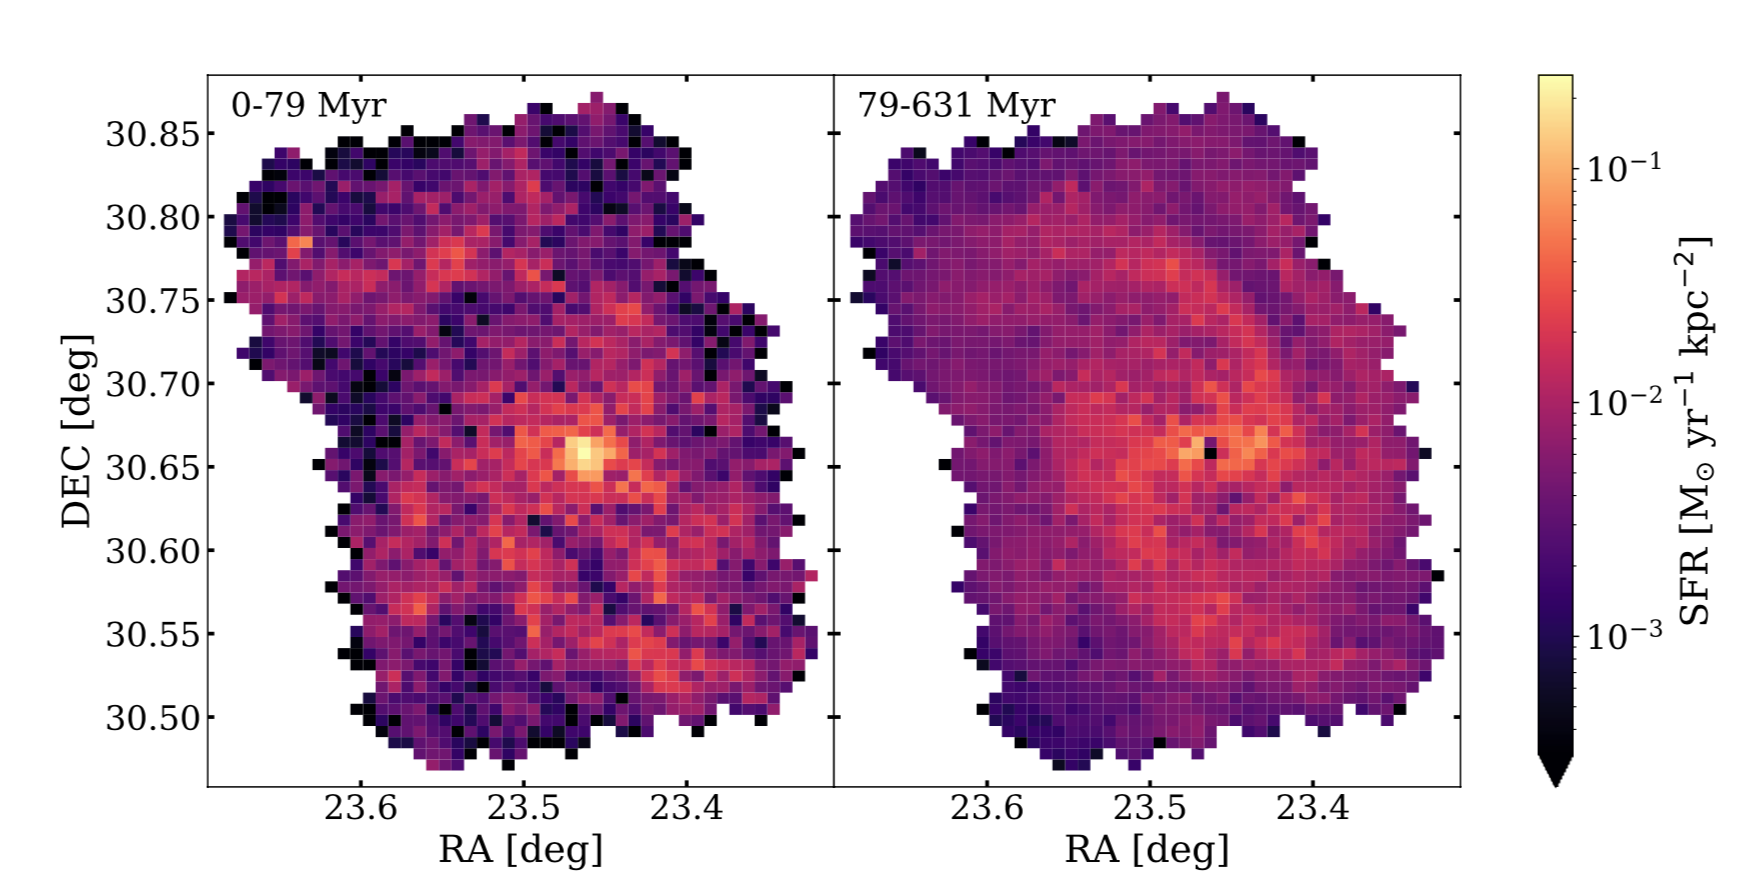
Figure 2: The spiral structure clearly evolves from 79–631 million years ago to 0–79 million years ago, indicating a transition in the spiral structure of Messier 33 around 79 million years ago from a two-armed barred spiral structure (right) to the more flocculent spiral structure we observe today. [Lazzarini et al. 2022]
Original astrobite edited by Isabella Trierweiler.
About the author, Abby Lee:
I am a graduate student at UChicago, where I study cosmic distance scales and the Hubble tension. Outside of astronomy, I like to play soccer, run, and learn about fashion design!