
Editor’s Note: Astrobites is a graduate-student-run organization that digests astrophysical literature for undergraduate students. As part of the partnership between the AAS and astrobites, we occasionally repost astrobites content here at AAS Nova. We hope you enjoy this post from astrobites; the original can be viewed at astrobites.org.
Title: Bumpy Declining Light Curves Are Common in Hydrogen-Poor Superluminous Supernovae
Authors: Griffin Hosseinzadeh et al.
First Author’s Institution: Steward Observatory, University of Arizona
Status: Published in ApJ
Space is constantly alight with supernovae — so much so that astronomers are scrambling to keep up! As a result, interest and competitive resources can fall off after a supernova has been named and identified, making it difficult to observe superluminous supernovae months after the dazzling heights of their light curves.
Brighter than a typical supernova, superluminous supernovae reach blinding absolute magnitudes of −20 or more. Miraculously, their super-powered light curves remain bright for hundreds of days before decreasing to a known slope called a radioactive tail.
The authors argue that this period of time after the initial explosion is well worth the study, because some superluminous supernovae don’t cool off without a fight. Instead, they display unanticipated bumps and wiggles months after the peaks of their light curves. Shared qualities amongst the supernovae that show wiggles could even shed light on the mechanisms powering these behemoths.
What’s Haunting the Cosmic Graveyard?
The source behind monstrous superluminous supernova explosions is a topic of hot debate, especially when it comes to the subclass that have spectra devoid of emission lines of hydrogen. There are two main competing theories. The first is that there is a super-powered neutron star called a magnetar at the center. With the most extreme magnetic fields in the universe, reaching a magnetic field strength of 1015 Gauss, these colossal corpses would serve as a “central engine” driving the explosion’s brightness and prolonging its light curve.
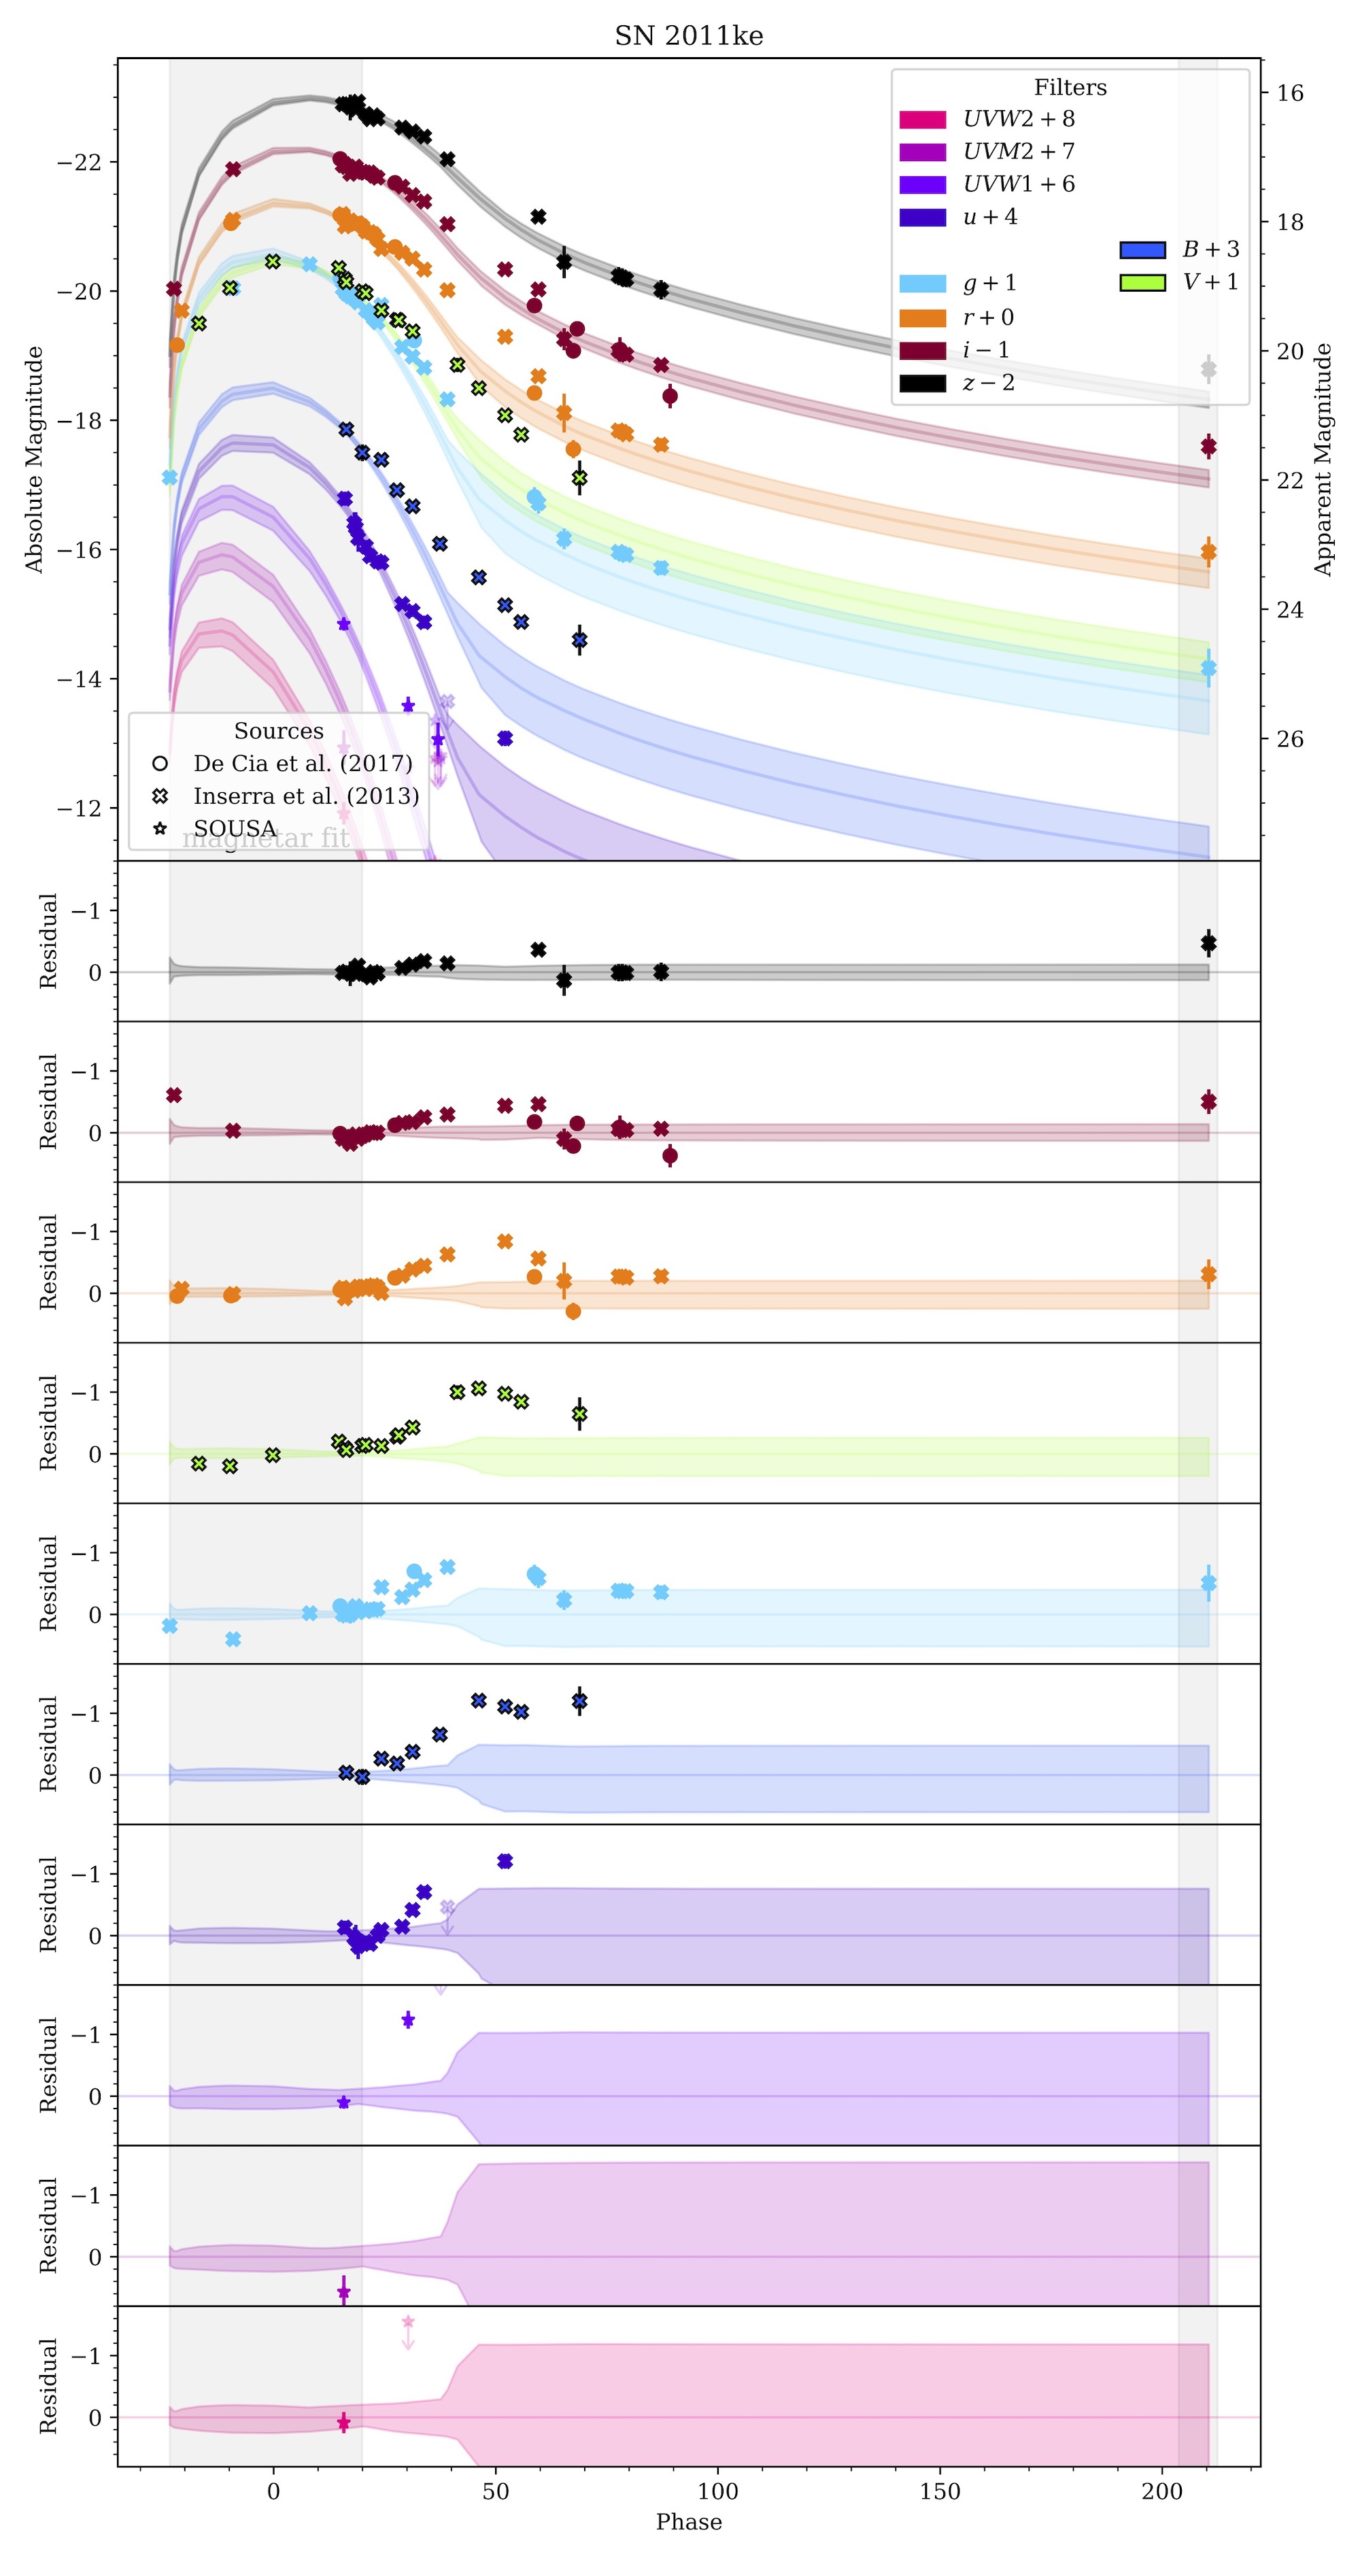
Figure 1: An example superluminous supernova, SN2011ke. Bumps begin about 40 days after the explosion in nearly every observed wavelength. In the residual panels, the authors subtract the underlying blackbody to make this clearer. Click to enlarge. [Adapted from Hosseinzadeh et al. 2022]
Others posit that hydrogen-poor superluminous supernovae — subclass SLSN-I — once had hydrogen on their surfaces, but they dropped that hydrogen like a pair of lost glasses. Surely it must be around here somewhere… crunch. The unaware explosions trample over the circumstellar material as it expands. This interaction would serve as multiple powder kegs prolonging the light curve in a manner similar to the magnetar model. Yet, when astronomers take spectra during SLSN-I bumps, they do not find the smoking-gun evidence of narrow emission lines that would indicate interaction with hydrogen-rich material.
That Ghost Has Footprints!
The authors collected a total of 34 SLSNe-I with plenty of optical data well after their peaks. Of these 34, they find that 44–76% exhibit bumps at about 50 days or more past explosion. Why the broad uncertainty range? Because, unfortunately, the consistency of data coverage limits how sure the authors can be that these bumps exist. Among their sample, they investigate what these bumps have in common and if there are relationships between the overall light curve and the bumps.
The authors reason that there are five main characteristics of a magnetar: magnetic field (B), spin period (P), ejecta mass (Mej), ejecta velocity (vej), and the time it takes for the explosion to reach its peak brightness (trise); and there are four main characteristics of a bump: duration (Δtbump), the time the bump occurs (tbump), the temperature at which it is emitting (Tbump), and amplitude. The authors cross-compare each of these characteristics by mixing and matching their axes and plotting all 34 superluminous supernovae in Figure 2. Then, they check for correlation, or a clear and obvious trend, between the quantities on each set of axes.
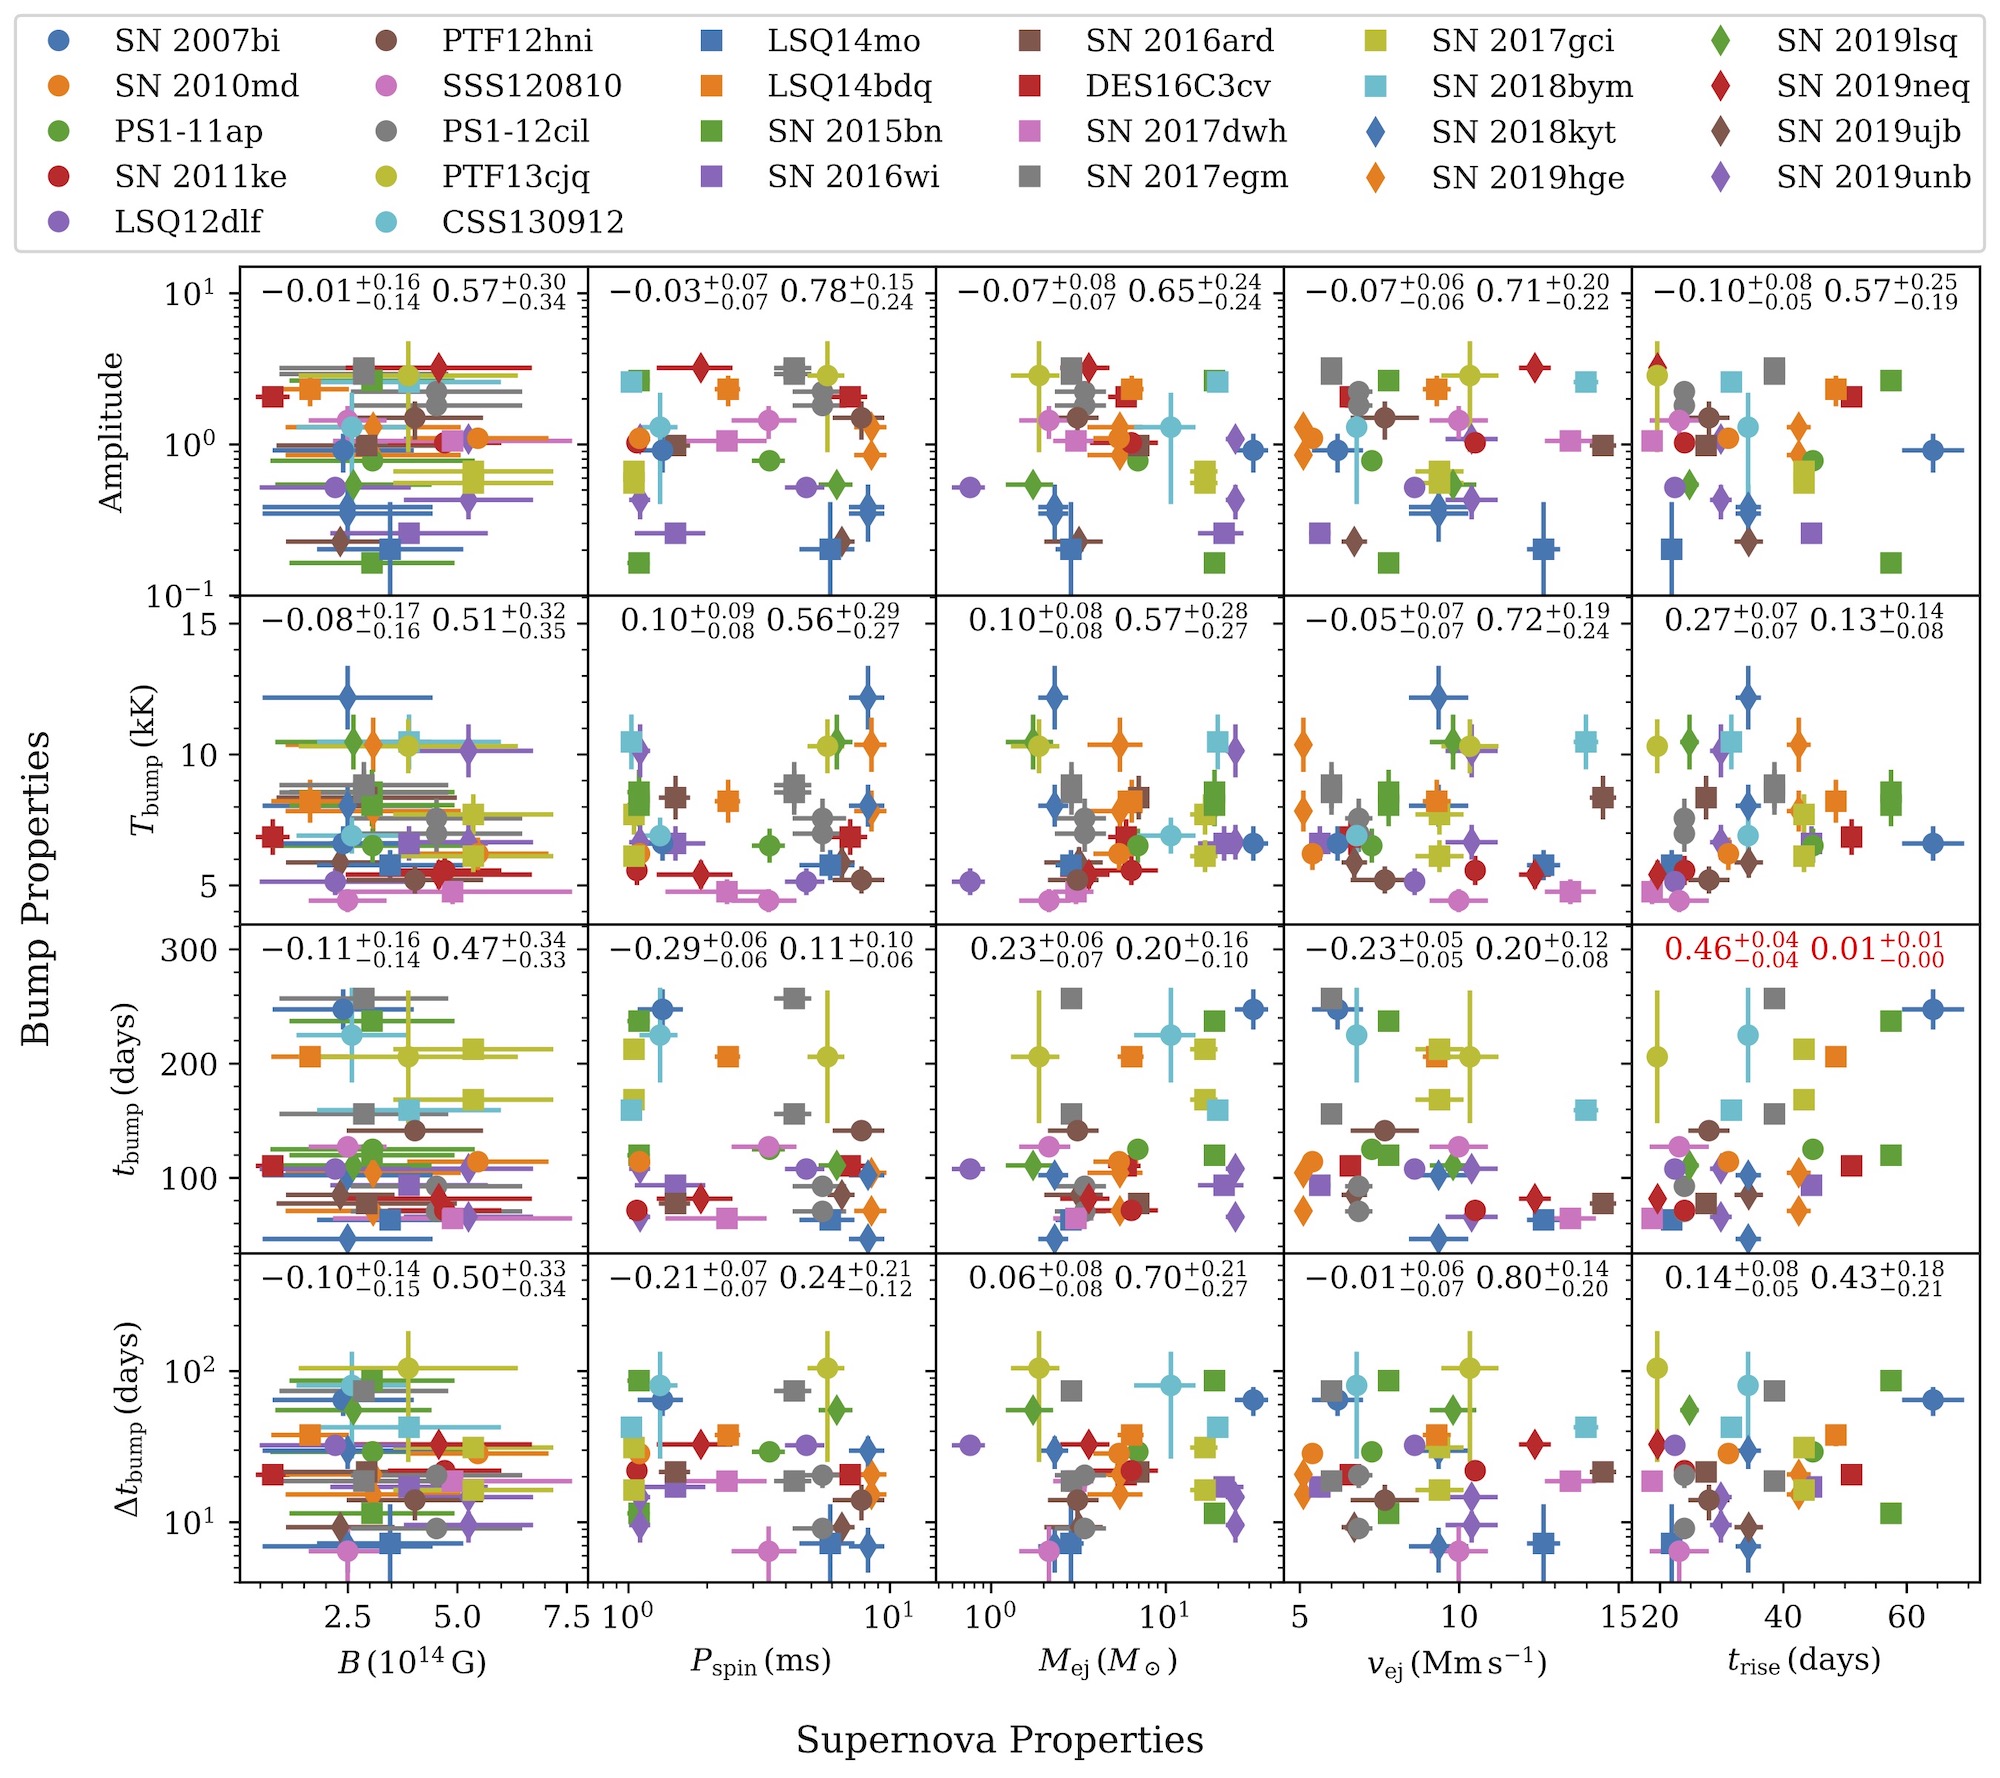
Figure 2: Which properties exhibit a trend? The authors believe the rise time (trise) of the explosion and the time the bump occurs (tbump) are very weakly correlated. To convince yourself, find the panel with the red text (last column, third row) and ask yourself how much you think increasing trise increases tbump, and vice versa. [Hosseinzadeh et al. 2022]
If the bumps are instead caused by interaction with circumstellar material, the authors determine it would be an optically thin shell with an average mass of 0.034 solar mass and a thickness of about 8.1 x 1015 cm. That’s not a whole lot of material, spread about a whole lot of space!
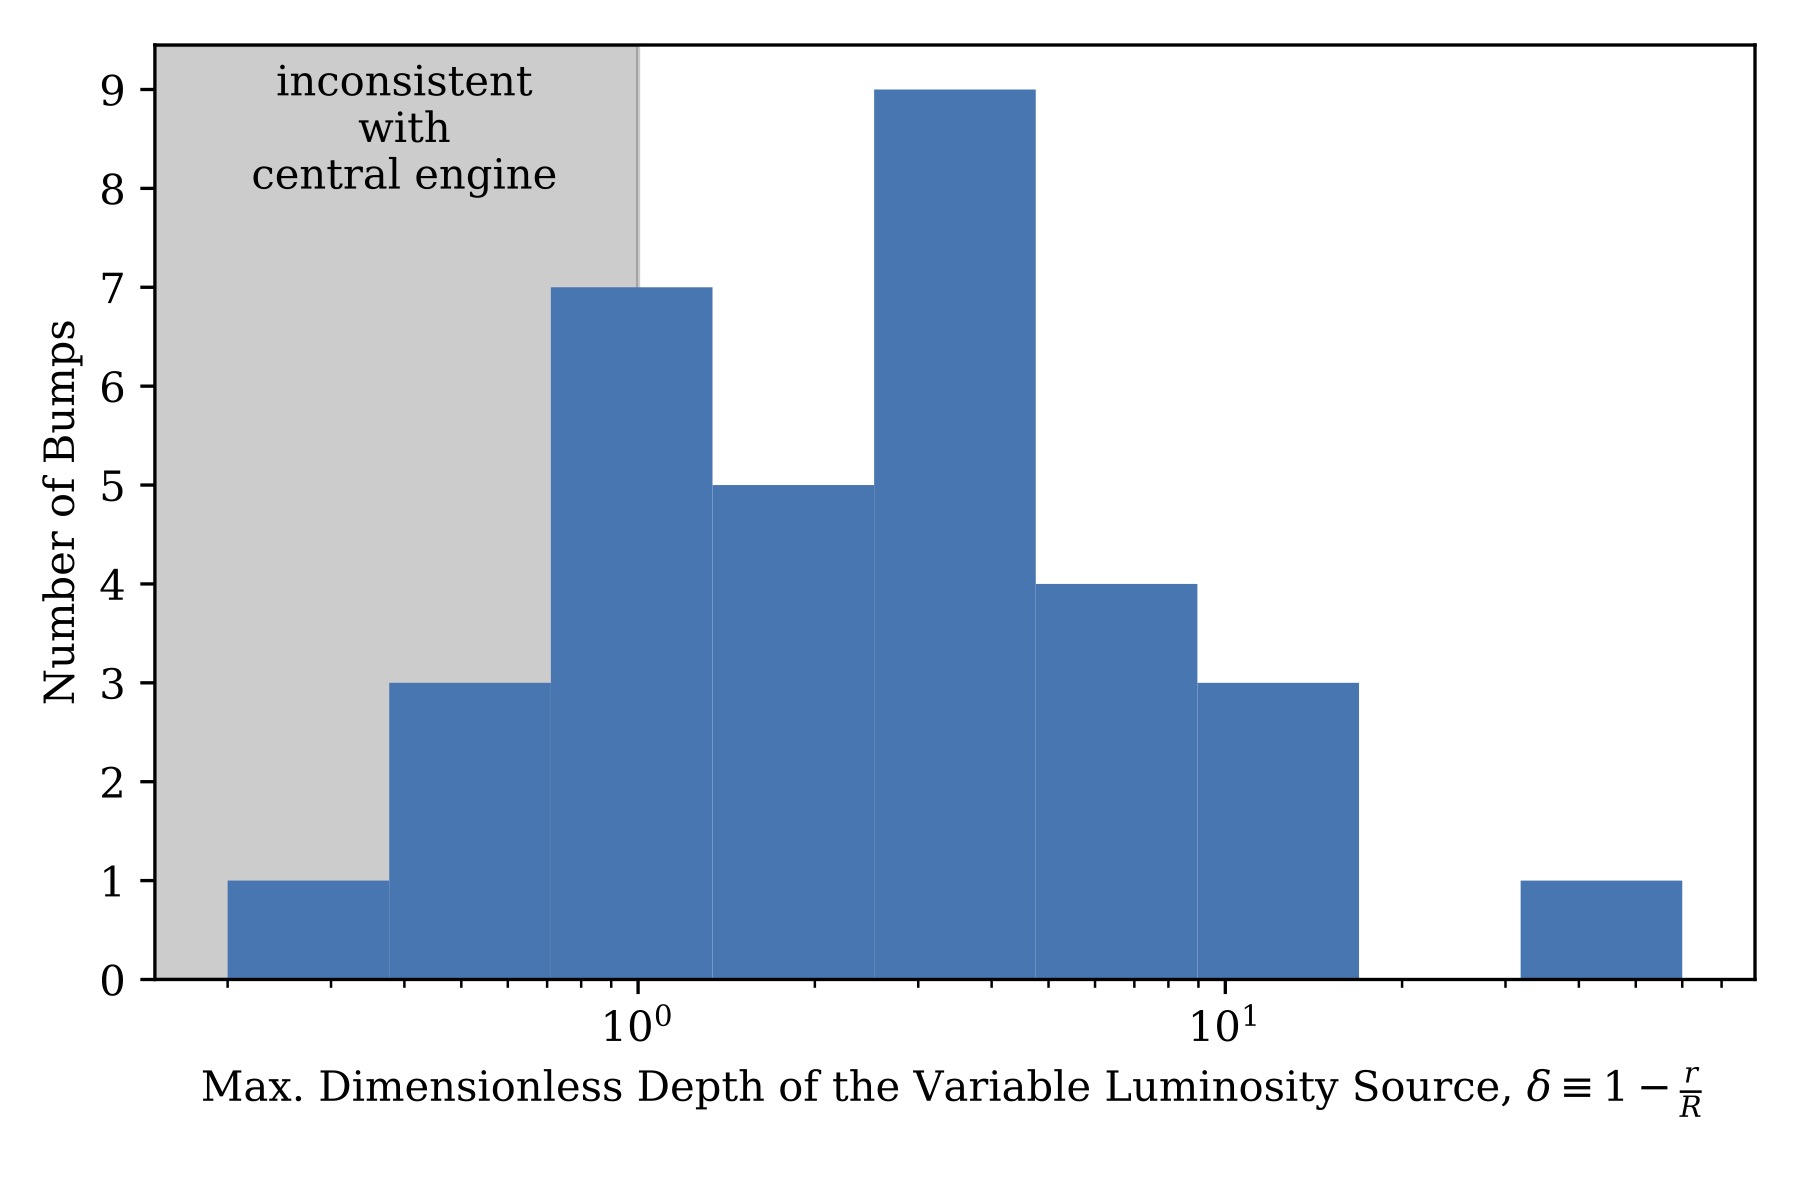
Figure 3: Histogram of superluminous supernova bumps and the maximum depth from which photons would have originated. Bumps in the shaded region are sourced from a maximum depth too shallow to be consistent with a central engine origin. [Adapted from Hosseinzadeh et al. 2022]
What remains unanswered, however, is whether or not all 34 supernovae must be explained by the same mechanism. If the answer is yes, then those meddling supernovae in the shaded region rule out a central engine entirely! If the answer is no, then it seems that since most bumps exist in the unshaded region, one could argue that there is diversity among the superluminous supernova mechanisms; perhaps those powered without central engines are simply rarer.
Original astrobite edited by Lina Kimmig and Briley Lewis.
About the author, Lindsay DeMarchi:
Lindsay DeMarchi is currently a graduate student at Northwestern University. She is obsessed with gravity and uses multi-messenger methods to analyze the final moments of stellar collapse.