
Editor’s note: Astrobites is a graduate-student-run organization that digests astrophysical literature for undergraduate students. As part of the partnership between the AAS and astrobites, we occasionally repost astrobites content here at AAS Nova. We hope you enjoy this post from astrobites; the original can be viewed at astrobites.org.
Title: A Large Population of Obscured AGN in Disguise as Low Luminosity AGN in Chandra Deep Field South
Authors: Erini Lambrides et al.
First Author’s Institution: Johns Hopkins University
Status: Submitted to ApJ
Light emanating from within a host galaxy travels a huge distance to reach an observer. Along its path, the photons can encounter obstacles that change their wavelength or diminish the total intensity of the light. Depending on the host galaxy’s orientation relative to Earth, said emission could even be impeded by material contained within the galaxy. This can make the identification and classification of the photon’s source much harder. Models predict that there are a huge number of active galactic nuclei (AGN) growing behind dense screens of gas and dust that surround their host galaxies. Deep X-ray surveys are thought to produce the most complete and unbiased surveys of the AGN population, but we have yet to observationally confirm the high predicted fraction of these obscured AGN. Today’s paper re-evaluated such a deep X-ray survey containing a large sample of AGN in the Chandra Deep Field South (CDFS) and investigated whether the lower luminosity sources are, in fact, bright sources hidden behind larger amounts of obscuring material than previously thought.
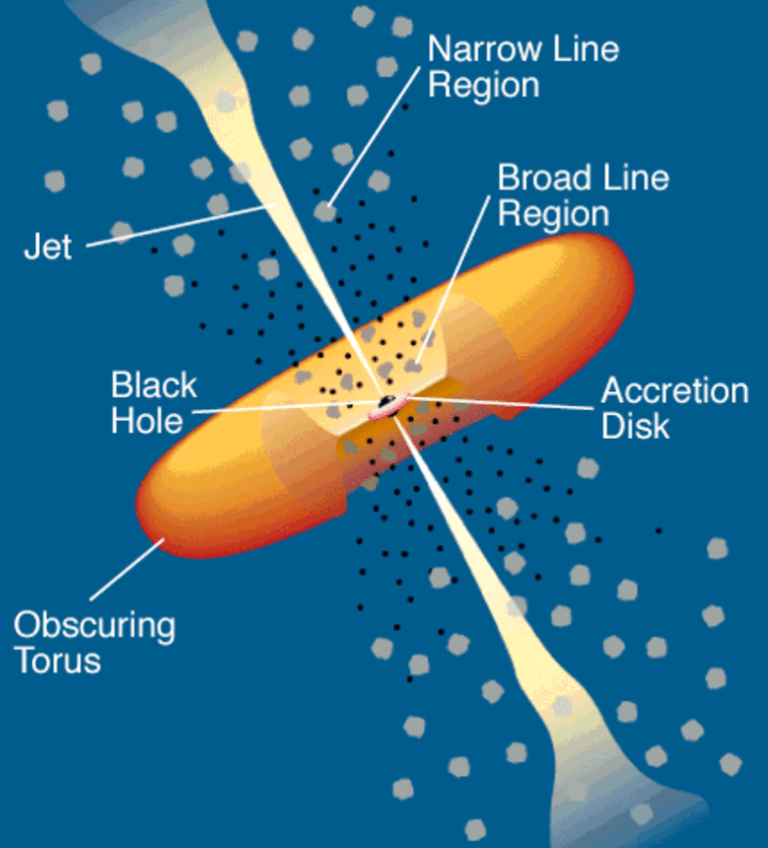
Figure 1: Standard model of an active galactic nucleus. [Urry & Padovani 1995]
Tales of the Un-Obscured
In an AGN, the observed X-ray emission is absorbed by material in the surrounding torus (Figure 1). This is then re-emitted at the 6 µm, mid-IR, wavelength by the torus. Assuming the original study correctly calculated the column density, we would expect these AGN to show a direct correlation between X-ray and mid-IR luminosity. However, there are a large number of AGN that have a much lower intrinsic X-ray luminosity for their torus luminosity, known as a ‘mid-IR excess’. In addition, 90% of these AGN are found in the faintest group of observations. Whilst this suggests that these faint AGN could be heavily obscured, there are a number of other possible explanations for why lower luminosity AGN have a mid-IR excess.
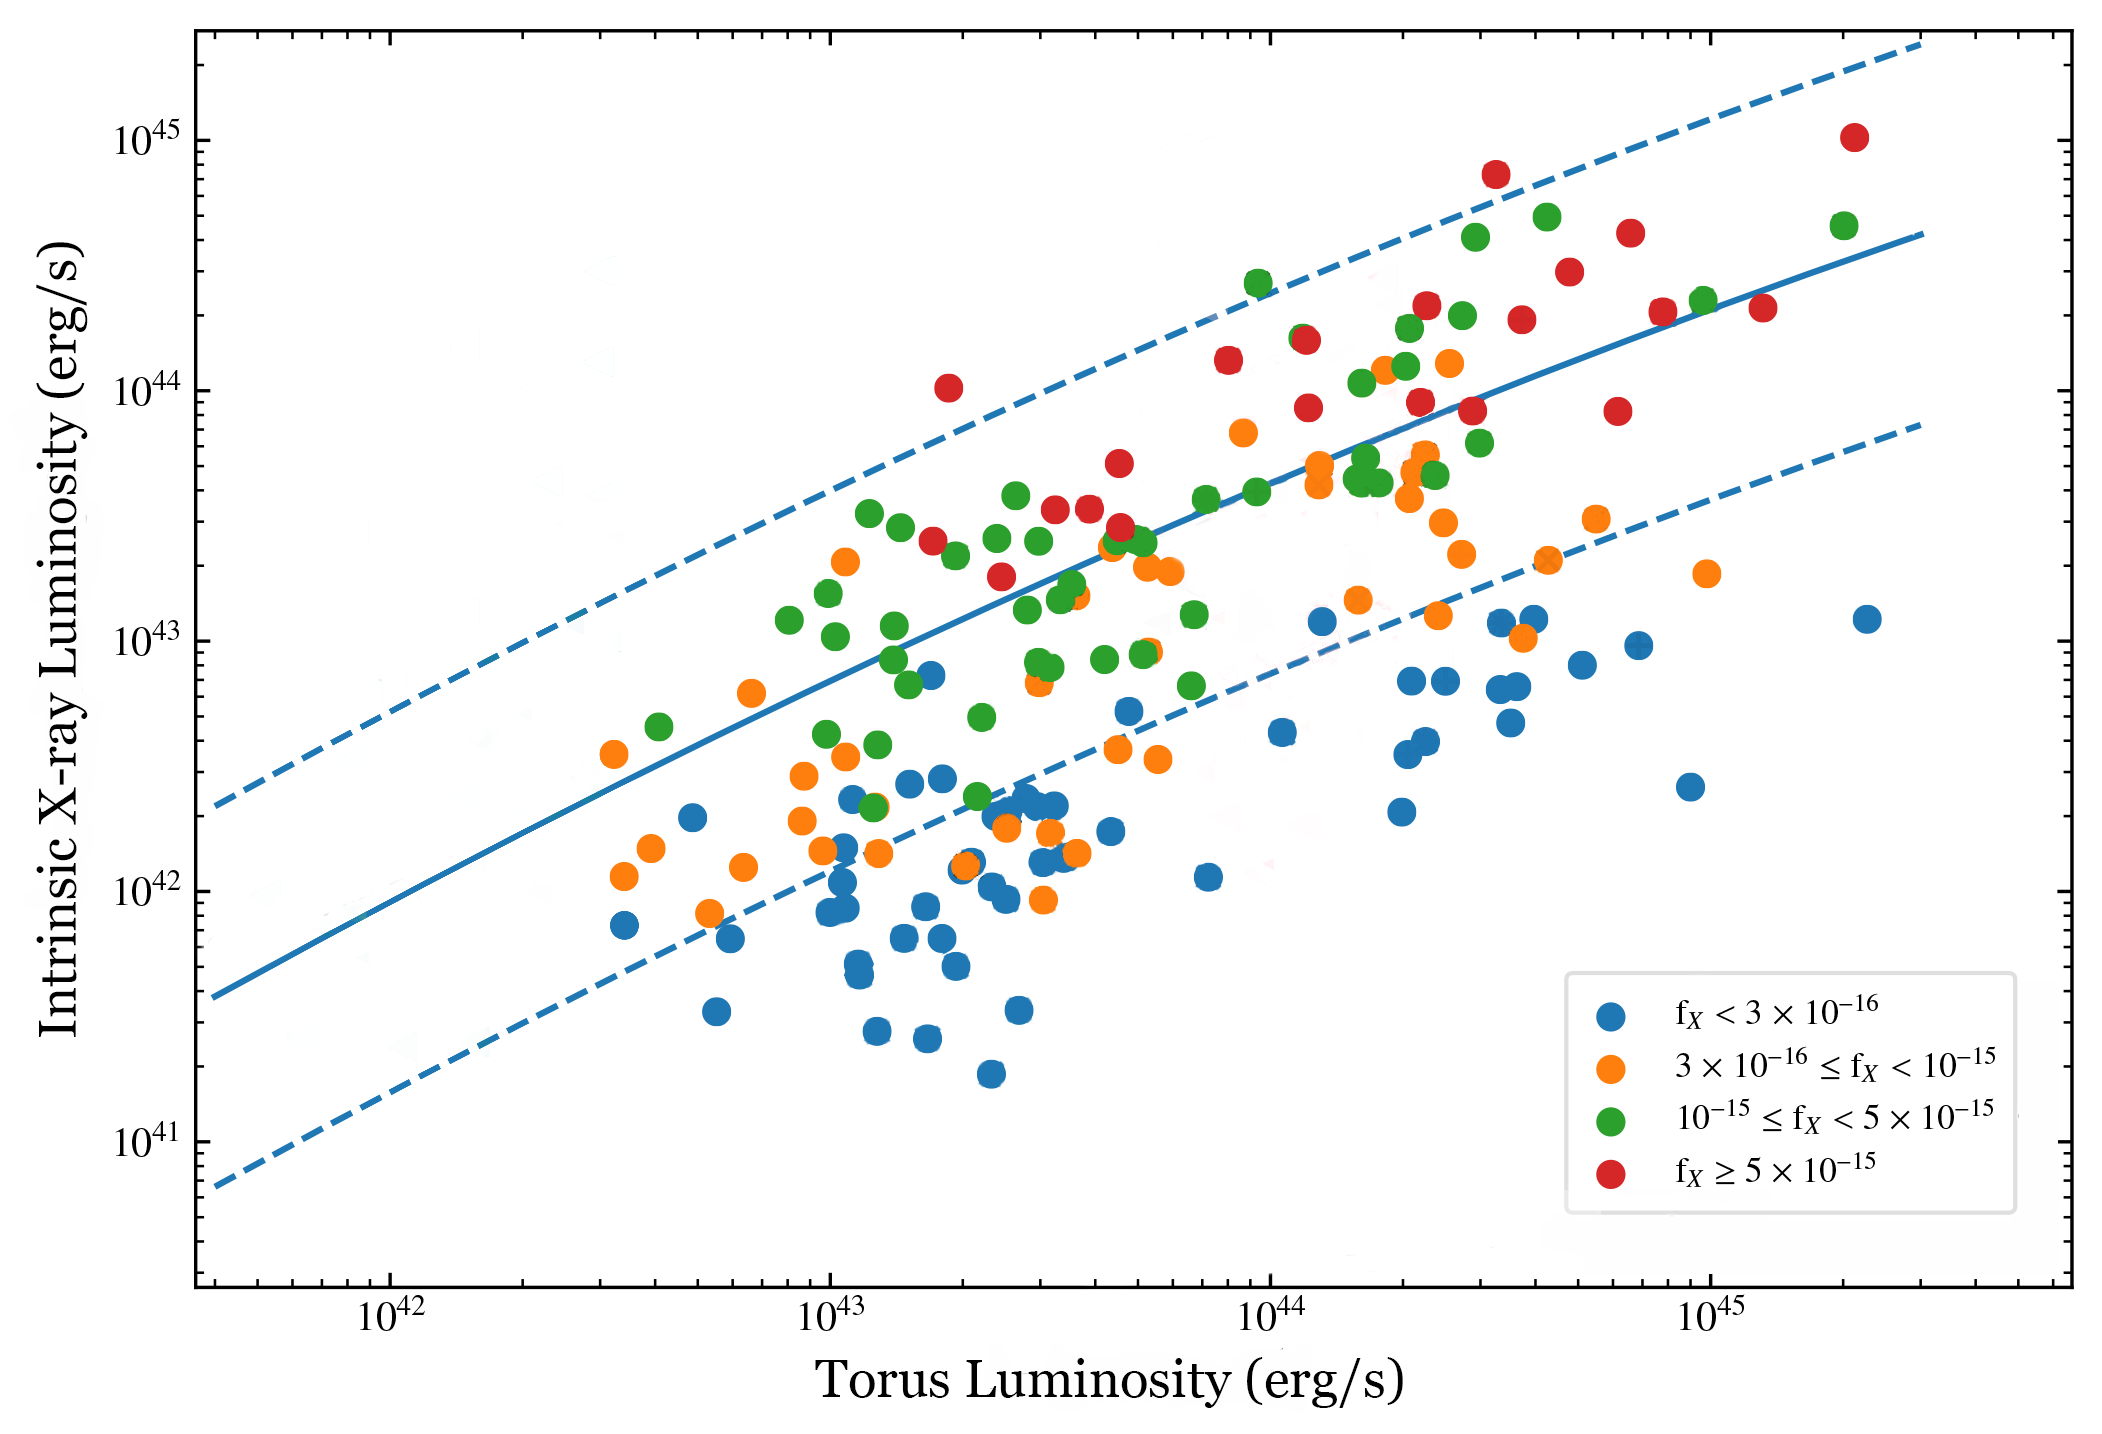
Figure 2: Comparing the intrinsic X-ray luminosity of an AGN against its torus luminosity. All of the AGN are coloured based on the group their observed flux falls into, with the faintest being blue ranging up to the most luminous in red. The dashed blue line highlights the region we expect an un-obscured AGN to lie within. [Lambrides et al. 2020]
One possibility is simply that the intrinsic X-ray luminosity is correct and we are observing an un-obscured AGN with genuinely lower emission than expected. In Figure 3, the authors compare the intrinsic luminosity to the [OIII] optical emission line luminosity — an independent measure of AGN activity — to see whether these AGN are intrinsically faint. Not only do the faint AGN (blue points) sit outside the region that suggests they are un-obscured, but they appear to be much more active than expected for their intrinsic X-ray luminosity and also occupy a similar region to obscured AGN from a previous study. So, these faint AGN don’t have an intrinsically lower activity, but they do behave similarly to obscured AGN.
![AGN luminosity vs [OIII]](https://aasnova.org/wp-content/uploads/2020/05/HIPS-Fig-2.png)
Figure 3: Comparing the intrinsic X-ray luminosity with the luminosity of the [OIII] optical emission line — an independent measure of AGN power. As with Figure 2, the AGN are coloured by their observed X-ray flux and we expect un-obscured AGN to lie within the dashed blue lines. There are also a number of AGN from a separate study: filled, grey points are un-obscured AGN and the hollow, grey points are obscured AGN. [Lambrides et al. 2020]
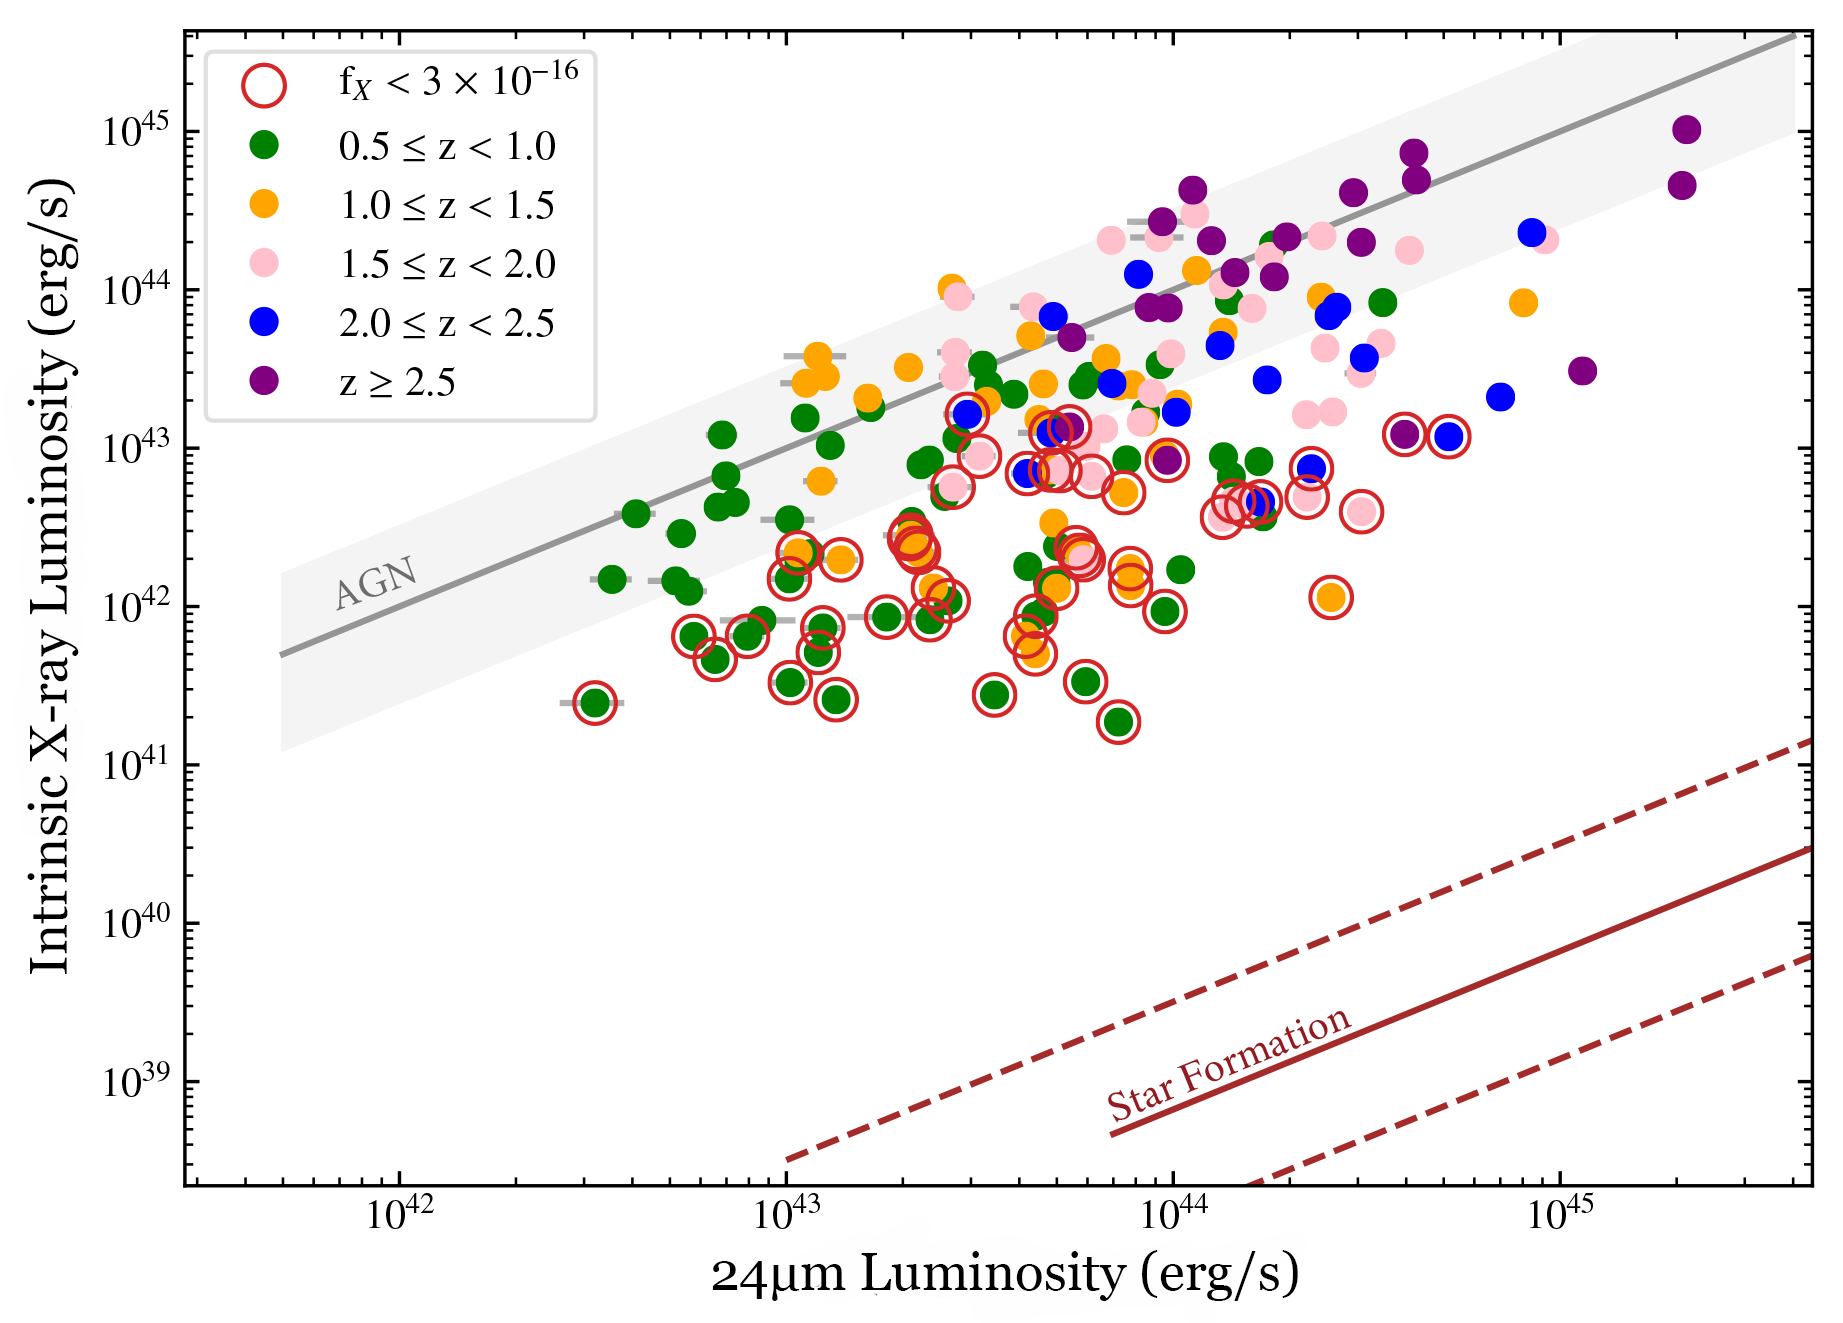
Figure 4: Comparing the intrinsic X-ray luminosity against the 24 µm luminosity. All of the AGN are coloured based on their redshift (as this determined the instrument recording 24 µm emission) but the lowest flux AGN (previously blue in Figures 2 & 3) are highlighted with red circles. Objects with 24 µm emission largely driven by the AGN are found in the grey region, whilst those driven by star formation would be found within the red region. [Lambrides et al. 2020]
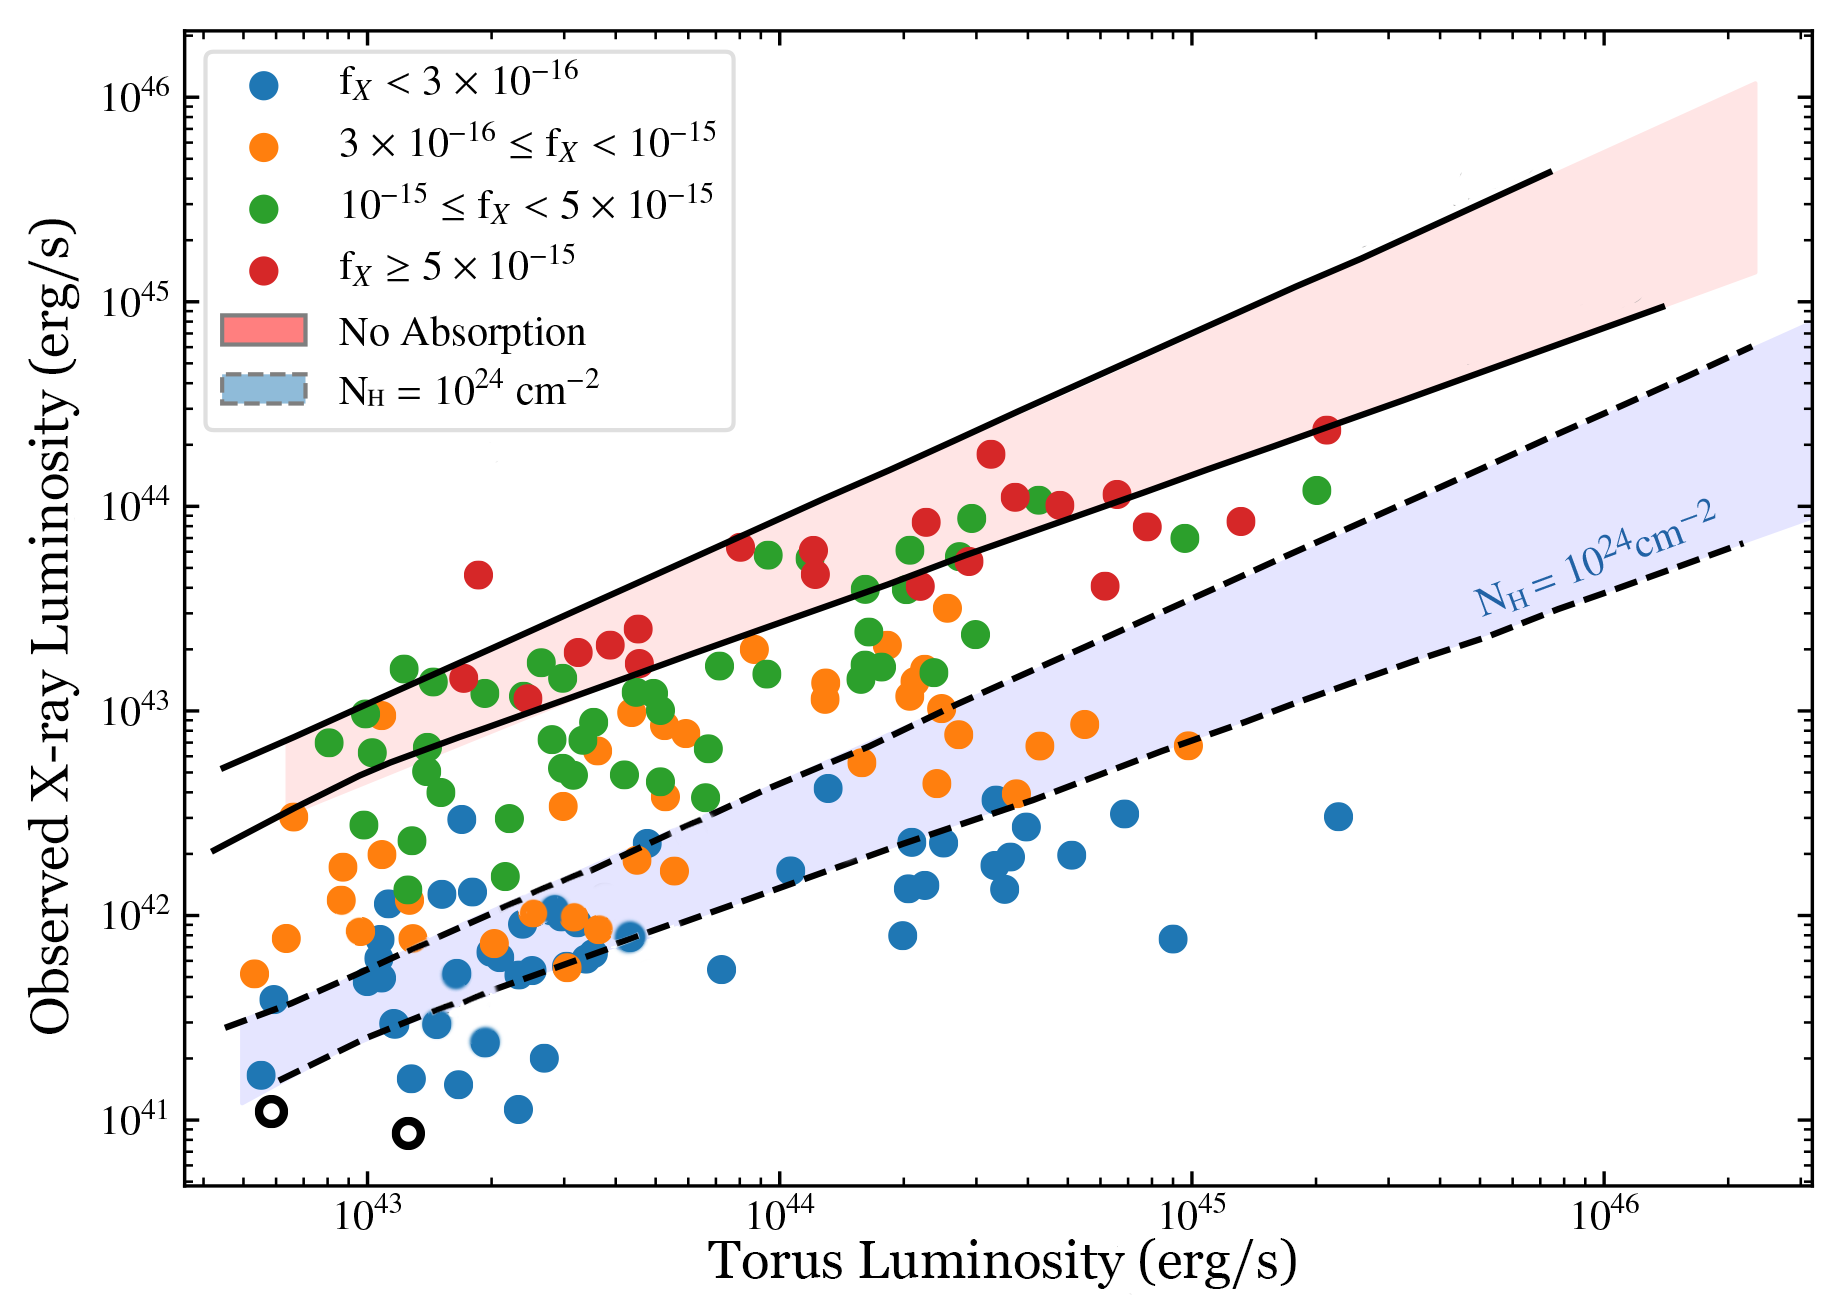
Figure 5: Similar to Figure 2, but instead comparing the observed X-ray luminosity with the torus luminosity. Overlain on these points are regions within which we would expect to find AGN of varying levels of obscuration. Un-obscured AGN are found within the red region, more heavily obscured AGN are found within the blue region. [Lambrides et al. 2020]
About the author, Keir Birchall:
Keir is a PhD student studying methods to identify AGN in various populations of galaxies to see what affects their incidence. When not doing science, he can be found behind the lens of a film camera or listening to the strangest music possible.