
Editor’s note: Astrobites is a graduate-student-run organization that digests astrophysical literature for undergraduate students. As part of the partnership between the AAS and astrobites, we occasionally repost astrobites content here at AAS Nova. We hope you enjoy this post from astrobites; the original can be viewed at astrobites.org.
Title: The Carnegie-Chicago Hubble Program. VIII. An Independent Determination of the Hubble Constant Based on the Tip of the Red Giant Branch
Authors: Wendy L. Freedman, Barry F. Madore, Dylan Hatt, Taylor J. Hoyt, In Sung Jang, et al.
First Author’s Institution: University of Chicago
Status: Accepted to ApJ
Author’s note: Credit for “H0tTake” goes to the conference “Tensions between the Early and the Late Universe” hosted at the Kavli Institute for Theoretical Physics!
The value of the Hubble Constant (H0) is a beast to pin down. However, it’s integral to our understanding of how the universe evolved and will continue to evolve. H0 relates the speed with which distant objects are moving away from us — due to the universe’s expansion — to how far away they are (see this Astrobite for a detailed explanation of how H0 assumed its place of importance). Measurements of H0 can be made using the early universe, from the cosmic microwave background (CMB), and the late universe, from distance measurements for stars, galaxies and other objects.
Under our current understanding of the universe, these two sorts of measurements ought to yield similar values of H0. Instead, we’ve witnessed a growing divergence between them that’s only gotten worse (or more interesting?) with time (see Figure 4, though it does come with a spoiler). Currently, early universe measurements of H0 rely on CMB observations made by the Planck satellite, while late universe measurements rely on Cepheid variables and Type Ia supernovae (Sne Ia). The discrepancy between these early and late measurements of H0 could be chalked up to new physics in the early universe that is outside our current models. But before claiming that, we’d want to rule out any hidden issues in how these measurements are being made.
On the side of the late universe, this requires using other astronomical objects to make measurements of H0 and to calibrate the distances to standard candles (objects whose brightness we understand very well), like Sne Ia. Very recently, a new measurement of H0 was announced, which used strong gravitational lens systems for distance calibration (see this Astrobite for a good summary). The paper being discussed in today’s Astrobite comes out of the Carnegie-Chicago Hubble Program, which was established to calibrate Sne Ia through alternate methods. Here, the authors use something called the Tip of the Red Giant Branch (TRGB).
The TLDR on the TRGB
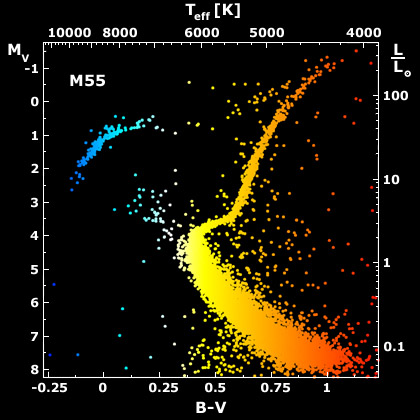
Figure 1. A color-magnitude diagram of globular cluster Messier 55 (M55). The TRGB can be seen at the upper-right. [B.J. Mochejska, J. Kaluzny (CAMK), 1m Swope Telescope]
The authors use the TRGB in lieu of Cepheids to calibrate the distances to galaxies that have hosted Sne Ia. TRGB stars have some advantages over Cepheids: they are much more common and can be found in uncrowded regions of their host galaxies, making them easier to identify. They also don’t need multiple observations to be recognized. Another useful quirk of TRGB stars is that their brightness in the I-band does not vary greatly with metallicity (the composition of the star), so the TRGBs in different galaxies shouldn’t look terribly different.
Could it (TRG)be?
In the near future, parallax measurements of Milky Way TRGB stars taken by the Gaia satellite will be available to anchor TRGB calibrations. For now, the authors use I-band observations of the Large Magellanic Cloud’s TRGB as well as parallax measurements for their analysis. The authors analyze the TRGB of 18 Sne Ia hosts, ranging from 7 to nearly 20 Mpc away, to calibrate the distances to those galaxies (see Figure 2). Their sample consists of galaxies that were not obscured by dust and had observations of their halos, where the TRGB could be cleanly measured. The TRGB calibrations were then used with a larger sample of Sne Ia to measure the distances to those Sne.
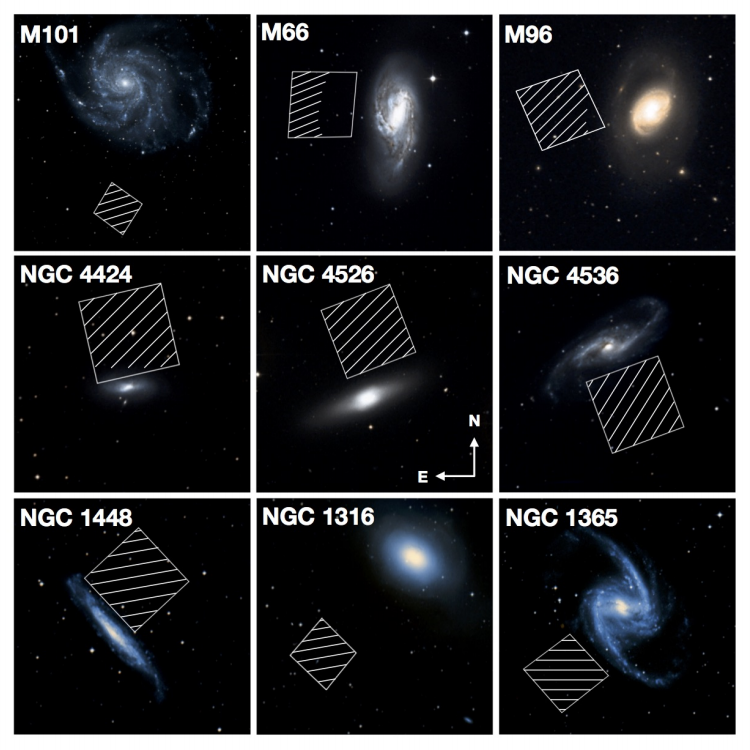
Figure 2. Nine of the eighteen Sne Ia host galaxies whose TRGB were studied. The squares represent the areas of the halo that were targeted. The hatched areas show the regions that were analyzed. [Freedman et al. 2019]
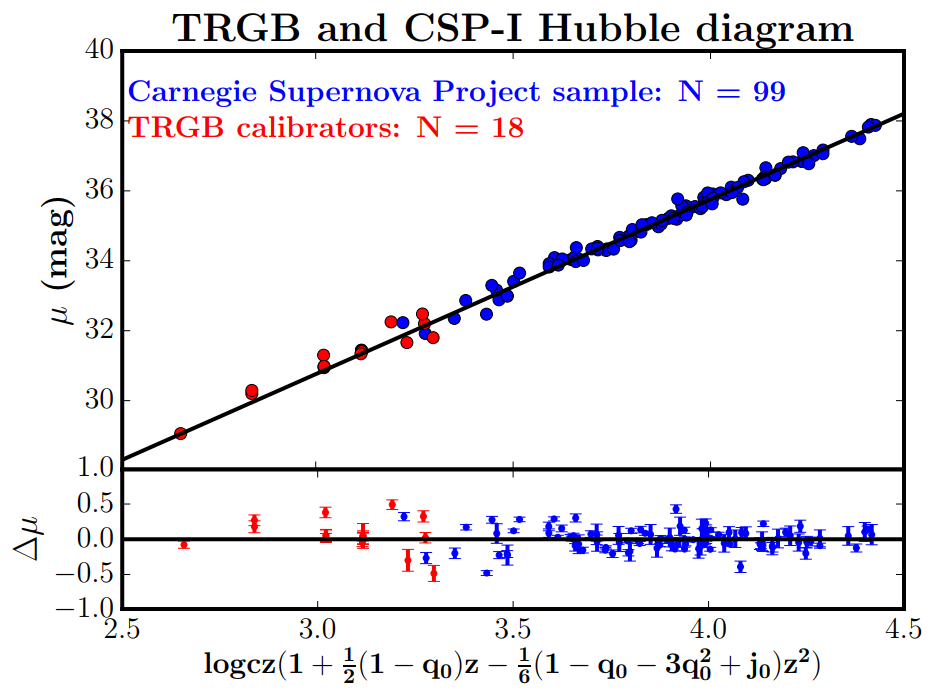
Figure 3. The Hubble diagram produced from the TRGB calibrators and Sne Ia from the Carnegie Supernova Project. The slope of the line is where the measurement of H0 comes from. The y-axis of the upper plot is the distance modulus (a measurement of distance using the relation between the absolute magnitude and apparent magnitude for an object). The y-axis of the lower plot is the difference between the points and the fit to the data. The x-axis of both plots is a quantity relating the distance modulus with redshift (see Section 7.1 of the paper). [Freedman et al. 2019]
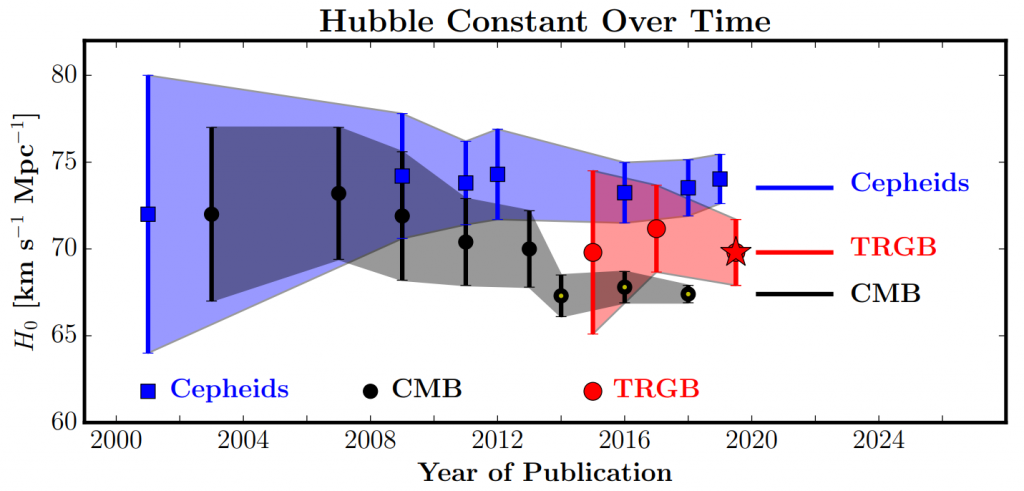
Figure 4. Measured values of H0 over time, showing where the TRGB measurement lands relative to the CMB and Cepheid measurements. The red star is the measurement from the paper being discussed. [Freedman et al. 2019]
About the author, Tarini Konchady:
I’m a graduate student at Texas A&M University. Currently I’m looking for Mira variables to better calibrate the distance ladder. I’m also looking for somewhere to hide my excess yarn (I’m told I may have a problem).