
Editor’s note: Astrobites is a graduate-student-run organization that digests astrophysical literature for undergraduate students. As part of the partnership between the AAS and astrobites, we occasionally repost astrobites content here at AAS Nova. We hope you enjoy this post from astrobites; the original can be viewed at astrobites.org!
Title: Wide-field Infrared Survey Explorer (WISE) Catalog of Periodic Variable
Authors: Xiaodian Chen, Shu Wang, Licai Deng, Richard de Grijs, and Ming Yang
First Author’s Institution: Key Laboratory for Optical Astronomy, National Astronomical Observatories, Chinese Academy of Sciences
Status: Accepted to ApJS
Figure 1. An artist’s conception of WISE. The spacecraft “is about the height and weight of a big polar bear, only wider“. [NASA/JPL-Caltech]
Given how useful they are, it stands to reason that creating a large, reliable sample of variable stars would be a great help for astronomers. The Wide-field Infrared Survey Explorer (WISE) is an infrared space telescope whose purpose is to image “the entire sky in the infrared” (see this Astrobite for an early overview of WISE’s goals and accomplishments). Between its initial mission (2009–2011) and its revival mission NEOWISE (2013–present), WISE has examined all sorts of objects, from asteroids to distant galaxies. In this paper, the authors searched for variable stars in the trove of WISE data to create a catalog of variable stars spanning the Milky Way.
CLASSIFIED (Just Kidding)
Between WISE and NEOWISE, about five years of data were available to the authors. They worked primarily with data taken in the W1 and W2 bands, since data could be taken in those bands even after WISE’s cryostat had failed. The authors used the Lomb-Scargle periodogram (see this blog post by Jake VanderPlas for more on that) to identify any periodicity, and excluded long-period or unstable objects to get a total of 50,296 variables.
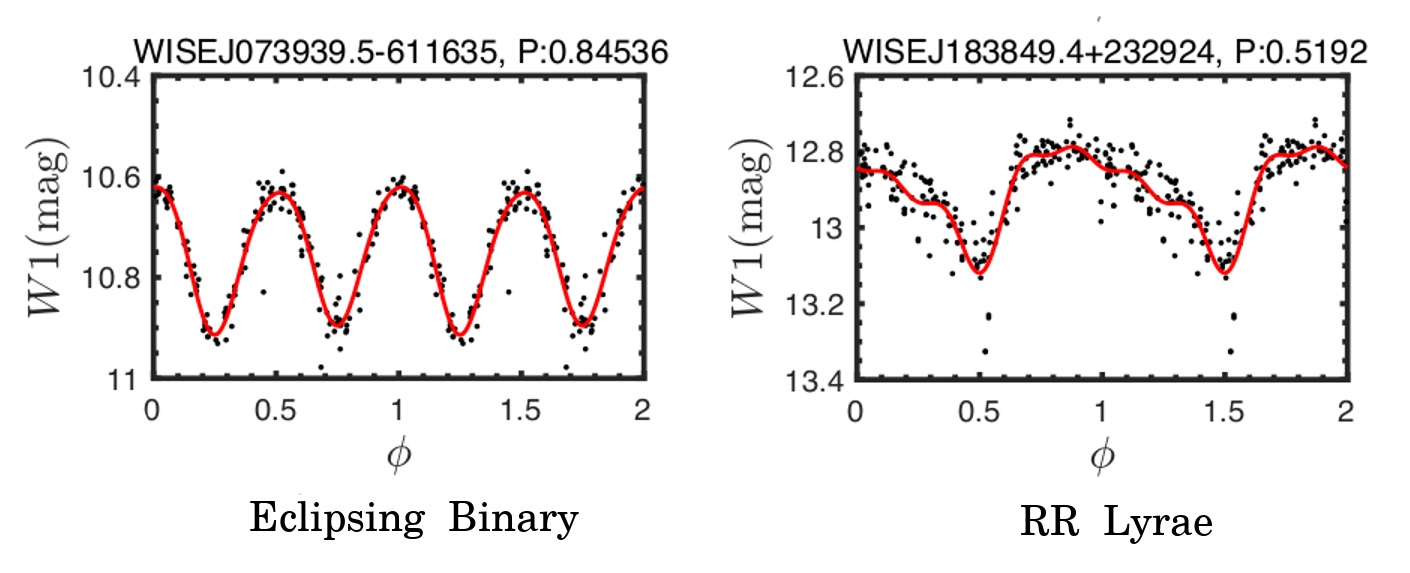
Figure 2. Example light curves of an eclipsing binary (left) and an RR Lyrae variable (right). The y-axis is the object magnitude in the W1 band and x-axis is the light curve phase. [Chen et al. 2018]
Light curves were particularly useful when it came to classifying the variables. In particular, extrinsic variables could be separated from intrinsic variables using their fairly symmetric shapes (see Figure 2). Light-curve amplitudes were also used to distinguish between the different types of variables.
Cataloging Differences
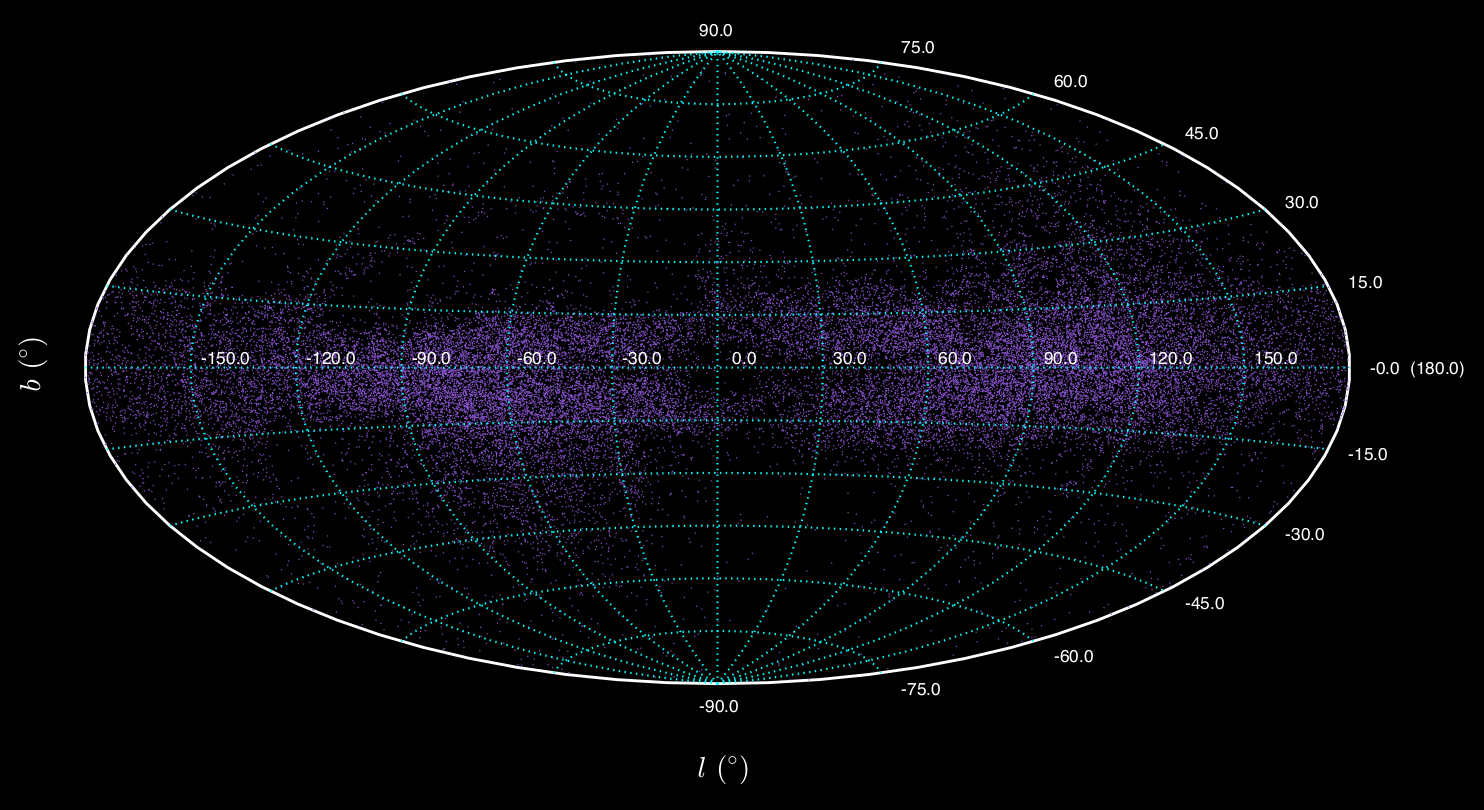
Figure 3. Map of Milky Way showing the location of the variables in the catalog. Most of the variables are concentrated near the galactic plane. [Chen et al. 2018]
A particularly promising result from the WISE data was that the periods of recovered Catalina variables were within 0.001 days of their measured periods in the optical. What this implies is that periods measured from infrared data are as usable as those measured in the optical. This is good to know — especially since most of the new variables lie within 20 degrees of the galactic plane, an area that cannot be probed with optical telescopes. The rest of the objects are located close to the equatorial poles (see Figure 3).
The result of the authors’ analysis is a catalog of 50,282 periodic variables with 17,000 variable candidates (follow-up needed!). Given that each variable has upwards of 100 detections, this catalog is very robust, and the variables listed within span a region of the Milky Way that hasn’t before been studied with these sorts of objects. When all is said and done, this paper details a resource that will be extremely helpful for studying galactic structure, stellar evolution, and more.
About the author, Tarini Konchady:
I’m a first year graduate student at Texas A&M University. Currently I’m looking for variable stars to better calibrate the distance ladder. I’m also looking for somewhere to hide my excess yarn (I’m told I may have a problem).