
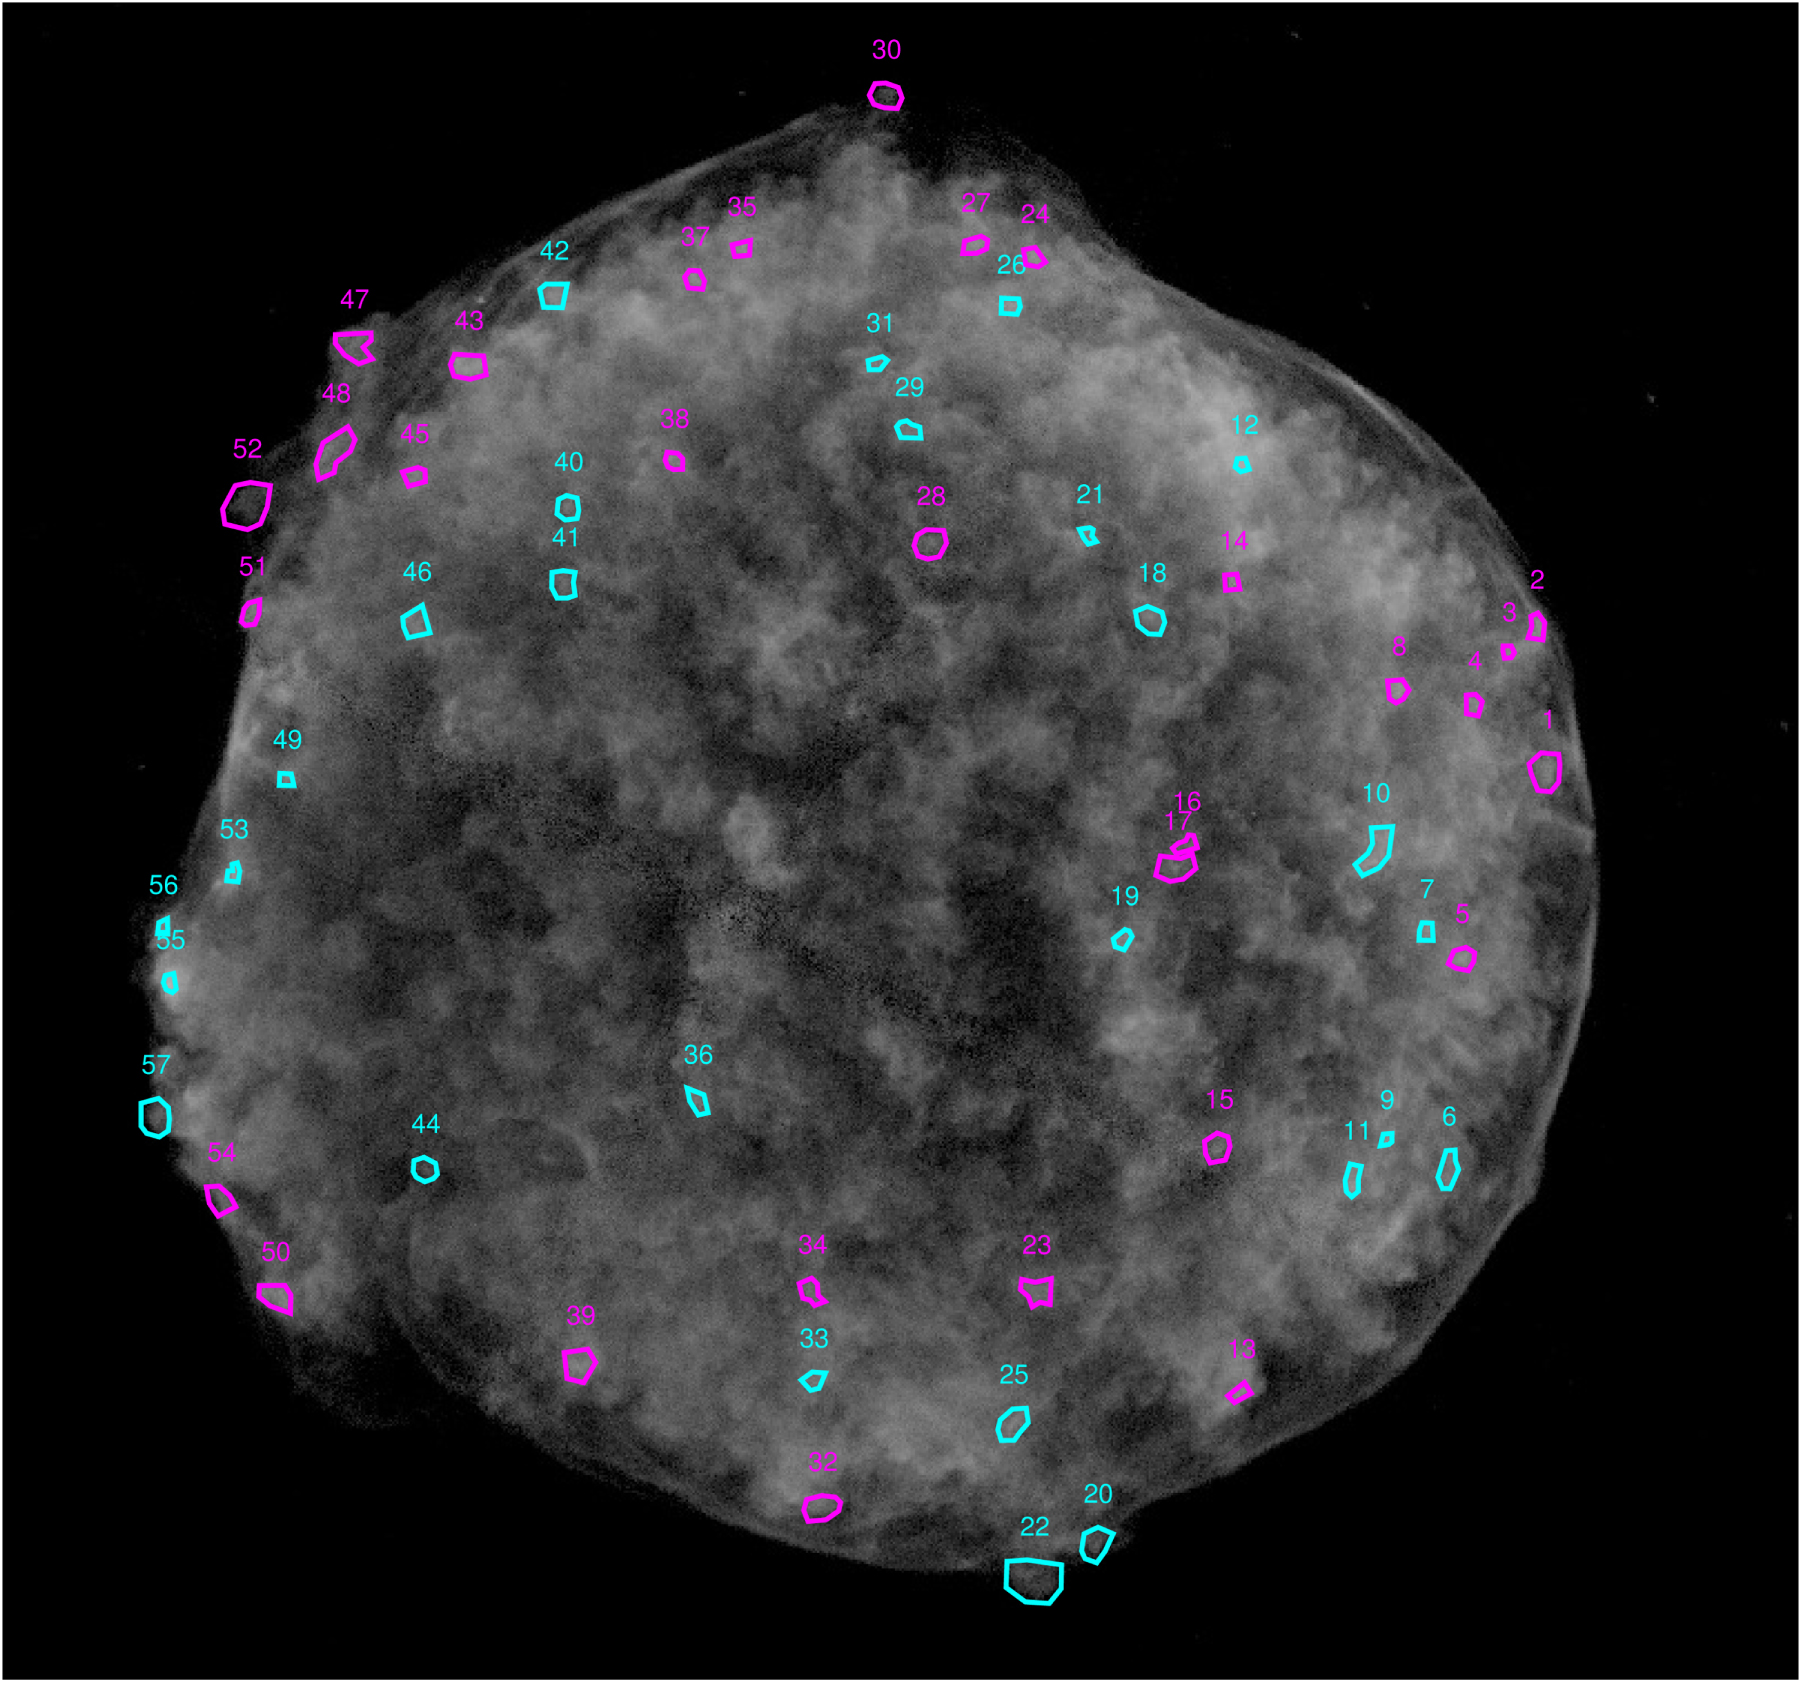
The outlined regions mark the 57 knots in Tycho selected by the authors for velocity measurements. Magenta regions have redshifted line-of-sight velocities (moving away from us); cyan regions have blueshifted light-of-sight velocities (moving toward us). [Williams et al. 2017]
Signs of Explosions
Supernova remnants are spectacular structures formed by the ejecta of stellar explosions as they expand outwards into the surrounding interstellar medium.
One peculiarity of these remnants is that they often exhibit asymmetries in their appearance and motion. Is this because the ejecta are expanding into a nonuniform interstellar medium? Or was the explosion itself asymmetric? The best way we can explore this question is with detailed observations of the remnants.
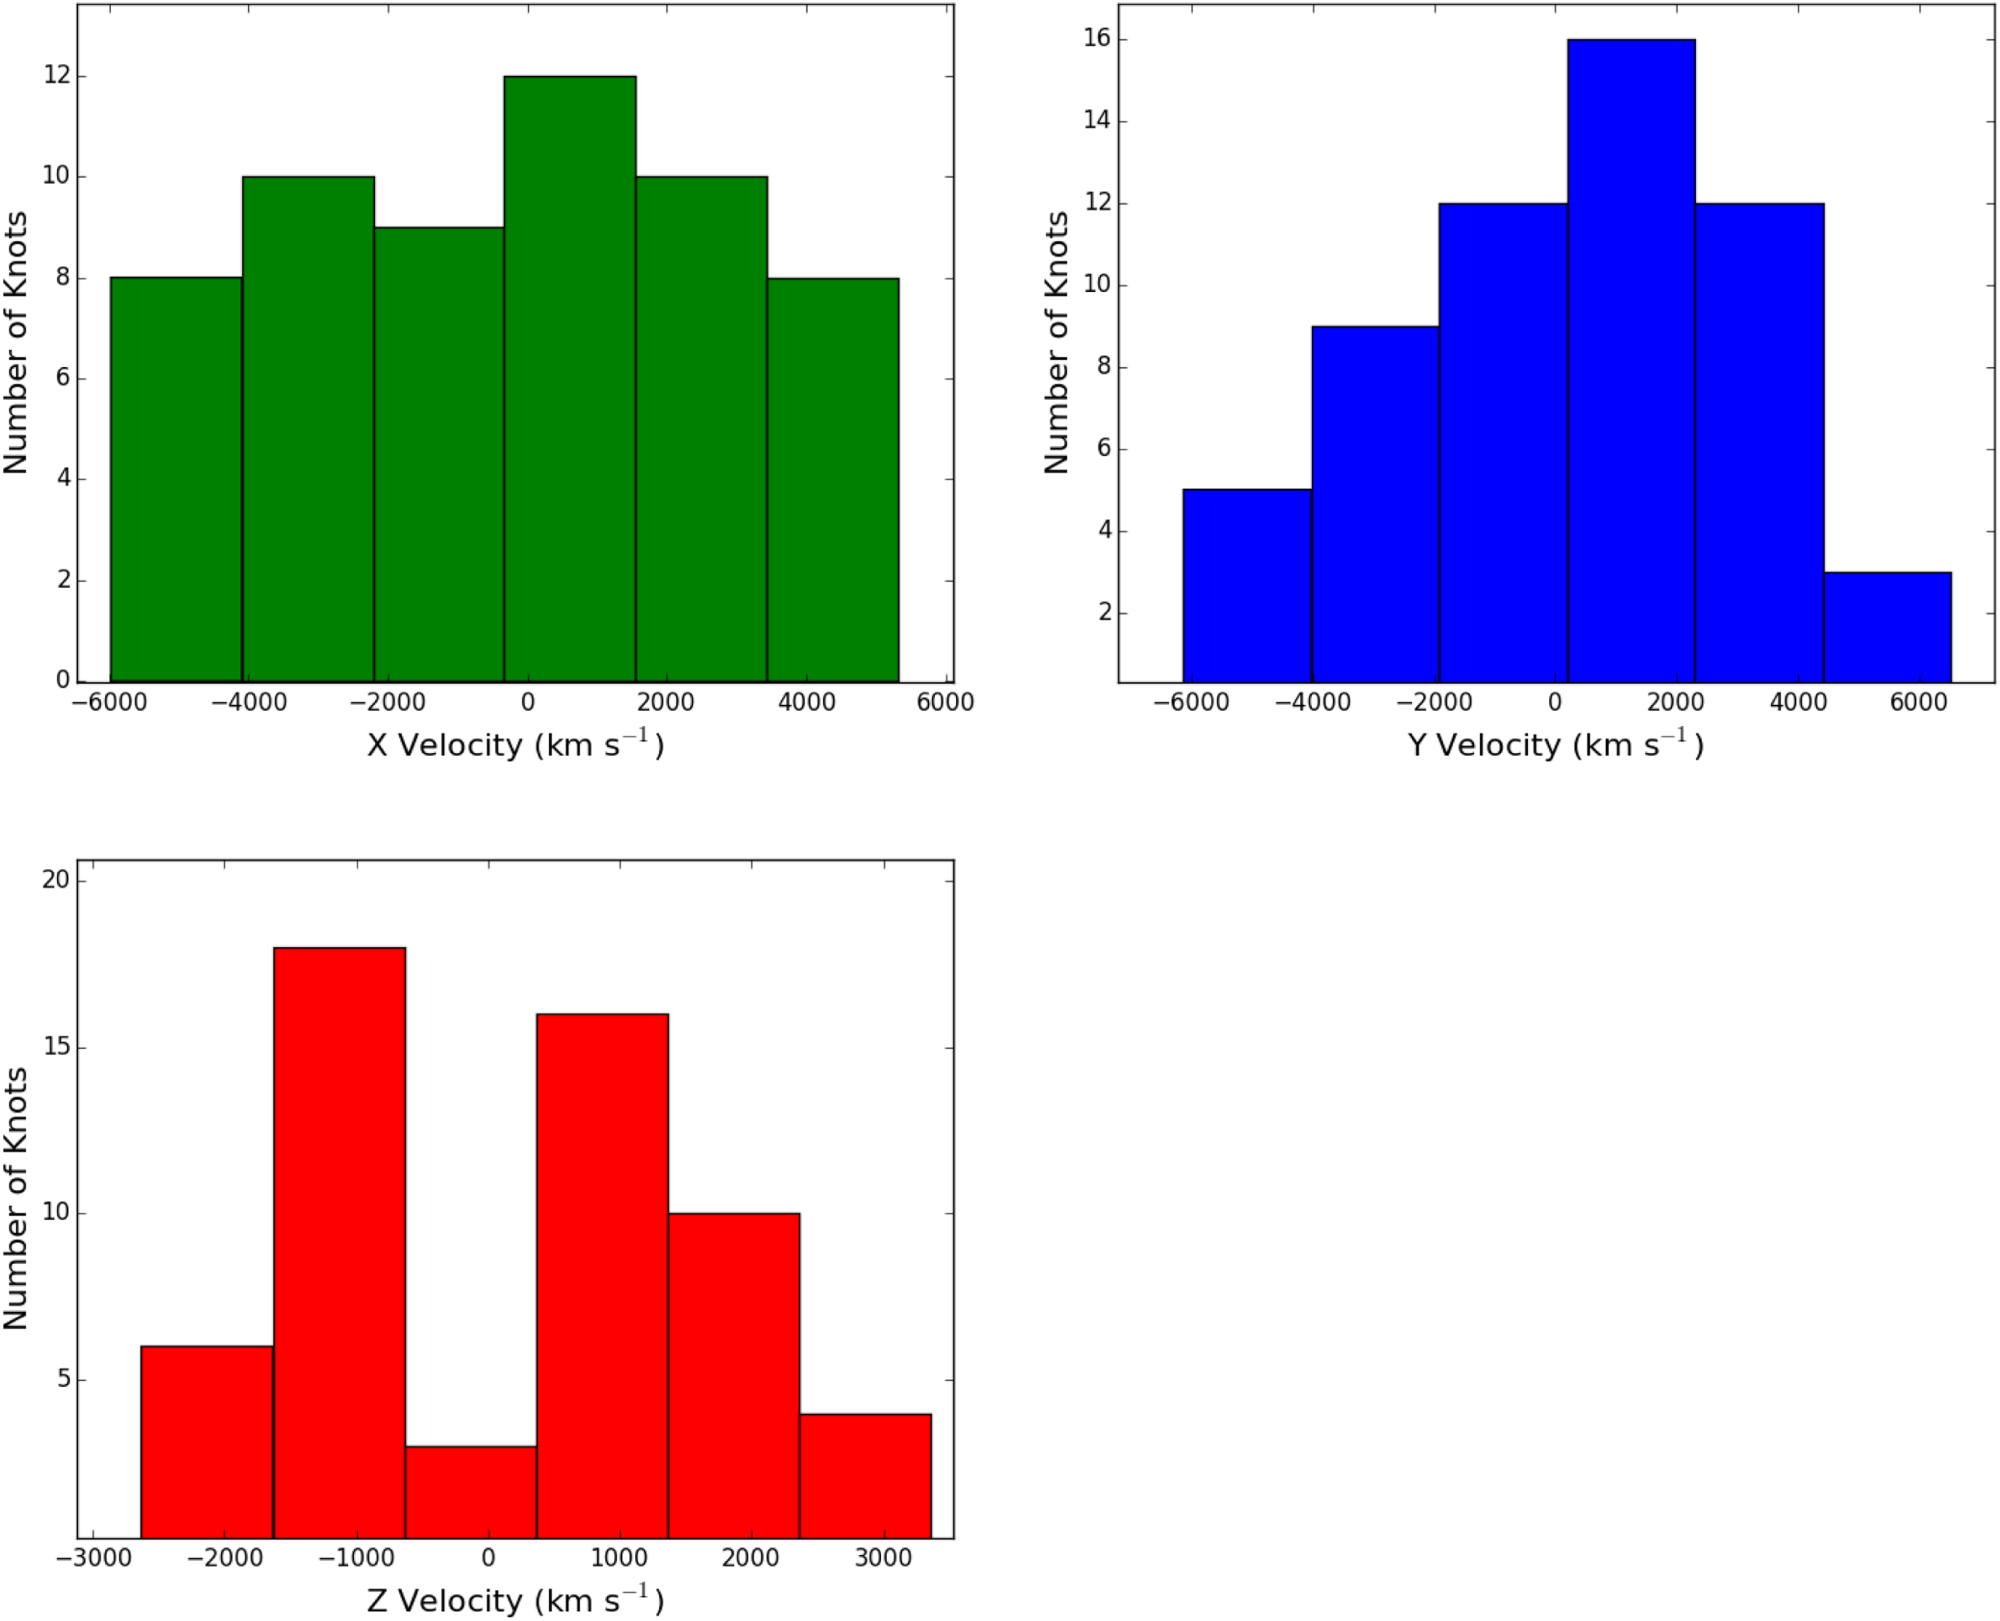
Histograms of the velocity in distribution of the knots in the X (green), Y (blue) and Z (red) directions (+Z is away from the observer). They show no evidence for asymmetric expansion of the knots. [Williams et al. 2017]
Enter Tycho
To this end, a team of scientists led by Brian Williams (Space Telescope Science Institute and NASA Goddard SFC) has worked to map out the 3D velocities of the ejecta in the Tycho supernova remnant. Tycho is a Type Ia supernova — thought to be caused by the thermonuclear explosion of a white dwarf in a binary system that was destabilized by mass transfer from its companion.
After ~450 years of expansion, the remnant now has the morphological appearance of a roughly circular cloud of clumpy ejecta. The forward shock wave from the supernova, however, is known to have twice the velocity on one side of the shell as on the other.
To better understand this asymmetry, Williams and collaborators selected a total of 57 knots in Tycho’s ejecta, spread out around the remnant. They then used 12 years of Chandra X-ray observations to measure both the knots’ proper motion in the plane of the sky and their line-of-sight velocity. These two measurements were then combined to build a full 3D map of the motion of the ejecta.
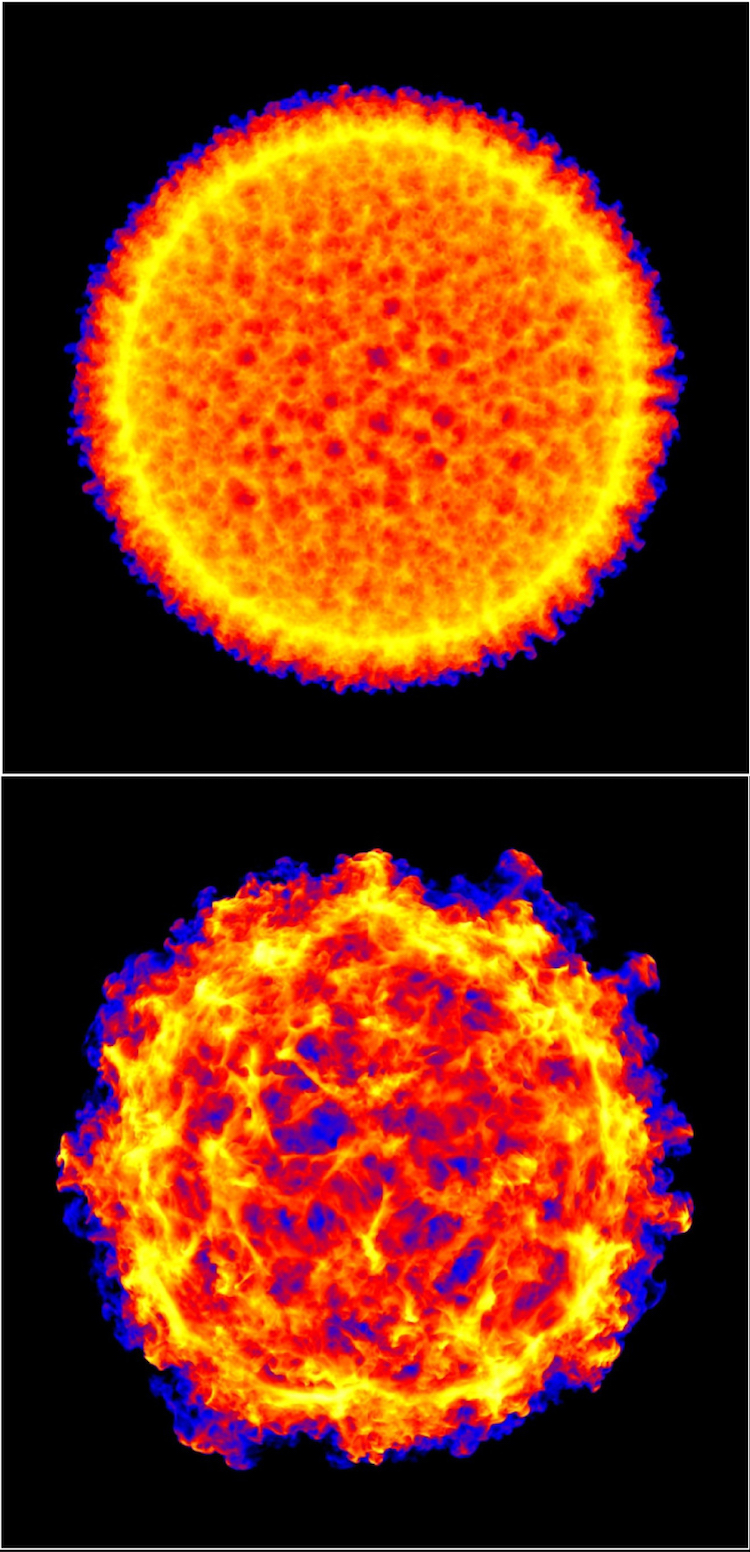
3D hydrodynamical simulations of Tycho, stopped at the current epoch. These show that both initially smooth (top) and initially clumpy (bottom) ejecta models are consistent with the current observations of the morphology and dynamics of Tycho’s ejecta. [Adapted from Williams et al. 2017]
Symmetry and Clumps
Williams and collaborators found that the knots have total velocities that range from 2400 to 6600 km/s. Unlike the forward shock of the supernova, Tycho’s ejecta display no asymmetries in their motion — which suggests that the explosion itself was symmetric. The more likely explanation is a density gradient in the interstellar medium, which could slow the shock wave on one side of the remnant without yet affecting the motion of the clumps of ejecta.
As a final exploration, the authors attempt to address the origin of Tycho’s clumpiness. The fact that some of Tycho’s ejecta knots precede its outer edge has raised the question of whether the ejecta started out clumpy, or if they began smooth and only clumped during expansion. Williams and collaborators matched the morphological and dynamical data to simulations, demonstrating that neither scenario can be ruled out at this time.
This first 3D map of a Type Ia supernova represents an important step in our ability to understand these stellar explosions. The authors suggest that we’ll be able to expand on this map in the future with additional observations from Chandra, as well as with new data from future X-ray observatories that will be able to detect fainter emission.
Citation
Brian J. Williams et al 2017 ApJ 842 28. doi:10.3847/1538-4357/aa7384
5 Comments
Pingback: Amerikan Gökbilim Derneği (AAS) Bülteni | Günün NASA Görüntüsü
Pingback: Imagen en 3D de un resto de supernova – Observatori Astronòmic
Pingback: Una supernova en 3D « SEDA / LIADA - RedLIADA - Cursos LIADA - Cielo del Mes - Fenómenos Astronómicos - RELEA
Pingback: 2017 HEAD: Day 3
Pingback: Exploding stars and sleight of hand: A case of magnetic misdirection | astrobites