
Editor’s note: Astrobites is a graduate-student-run organization that digests astrophysical literature for undergraduate students. As part of the partnership between the AAS and astrobites, we occasionally repost astrobites content here at AAS Nova. We hope you enjoy this post from astrobites; the original can be viewed at astrobites.org.
Title: The post-transit tail of WASP-107b observed at 10830Å
Authors: J. J. Spake, A. Oklopčić, L. A. Hillenbrand
First Author’s Institution: California Institute of Technology
Status: Submitted to AJ
Since the ground-breaking confirmation of the first exoplanet in 1992, astronomers have been finding and characterizing thousands of alien worlds in hopes of understanding the mechanisms behind planetary formation and evolution. Unsurprisingly, we get very excited about finding planets similar to ours, located in the “Goldilocks Zone” where potential life could thrive. But let’s not neglect the hidden gems that orbit much closer to their host stars! Not only are these among the first exoplanets we ever found, but their close proximity to their host stars gives us the unique opportunity to detect something that we wouldn’t be able to see otherwise: their atmospheres.
A Puffy Planet
A variety of different elements and spectral lines have been used to study exoplanet atmospheres: Lyman-α and Hα (both hydrogen lines) are most common, as well as other, heavier elements like carbon and oxygen. It wasn’t until very recently that we are also able to detect and use another element: helium. Ironically, helium is the second-most abundant element in the universe, but it is very hard to detect since helium is a noble gas — it’s difficult to excite enough to create absorption or emission. In 2018, astronomers detected helium for the first time in the exoplanet WASP-107b, a sub-Saturn orbiting a star a bit smaller and cooler than our Sun. In today’s paper, those same authors are now using the helium lines in this planet to learn more about its extended atmosphere.
Studying the chemical composition of exoplanet atmospheres can give us a lot of clues about their conditions and potential habitability. The authors of today’s paper are specifically interested in studying atmospheric escape, or how gases from the planet’s atmosphere gain enough energy to overcome the gravitational pull of the planet and escape into space. This can cause the planet to lose its “safety blanket” shielding it from harsh solar radiation, cosmic rays, potential asteroid impacts, and other life-threatening matter and radiation. This is especially evident in planets that orbit very close to their host star, where radiation and stellar wind can cause the atmosphere to evaporate away.
Let There Be Light!
But studying this is no piece of cake: we can’t actually point a telescope at WASP-107b and take a picture of its atmosphere. In fact, there have only been a handful of directly imaged exoplanets, as the glare from a host star far outshines any light coming from or reflected by a planet. Instead, we rely on obtaining spectra of the star during the exoplanet’s transit across its surface. When WASP-107b passes in front of its host star, a small portion of the light emitted from the star passes through the planet’s atmosphere and either penetrates it or gets absorbed, depending on the wavelength. Using a technique called transmission spectroscopy, we can figure out what elements are present in the atmosphere by looking at what wavelengths of light have been absorbed and then studying those absorption lines in more detail. By measuring the spectra both in transit (when the planet is passing in front of the star) and out of transit, astronomers can calculate the difference between these spectra and see which spectral lines have excess absorption. If an element is present in the exoplanet’s atmosphere, the measured spectral line should have a greater depth while the planet is in transit.
Using the Keck NIRSPEC spectrograph, the authors observed the absorption feature of WASP-107b at 10,833 Å, the wavelength around which three helium lines fall.

Figure 1: The out-of-transit (black) and in-transit spectrum (red) from the authors’ data. The vertical dotted lines show the positions of the helium triplet lines. [Spake et al. 2021]
The Same Procedure … Yields a Different Answer?
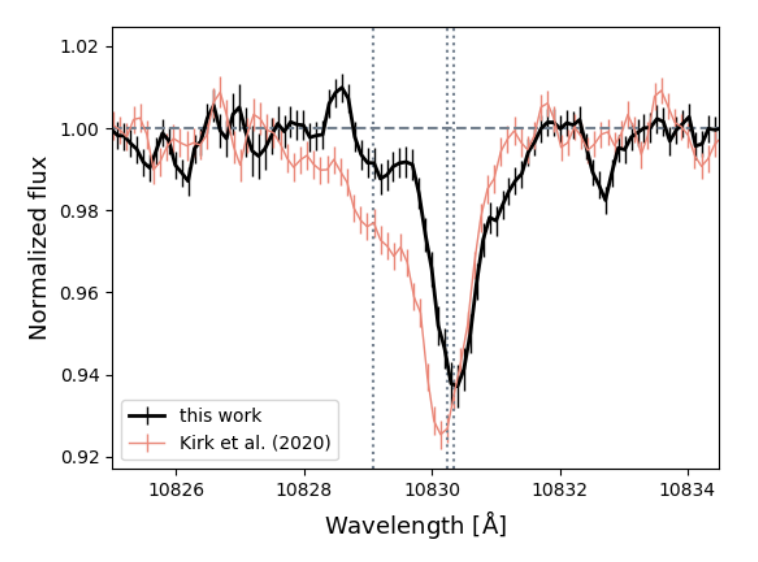
Figure 2: The ratio between the in-transit and out-of-transit spectrum from Figure 2, calculated for this paper’s data (black) and another group’s (Kirk et al. 2020) data (red). This paper’s data shows a shallower and redshifted dip compared to the data from Kirk et al. The vertical dotted lines are the position of the helium triplet lines. [Spake et al. 2021]
The ratio between the in- and out-of-transit spectra is shown in Figure 2, in black. The red line shows the same ratio, but using data from another group (Kirk et al.) that observed WASP-107b a few months later. Surprisingly, these spectra don’t match: the black spectrum has a shallower dip and looks redshifted in comparison. This is strange, because you would think that if you take a spectrum of the same planet, it would look very similar no matter when you got your data, since nothing about the planet or star should radically change over the span of a few months.

Figure 3: The integrated excess helium absorption light curve as WASP-107b transits across its host star, with data from this paper (black) and Kirk et al. 2020 (red). The light curve from a hydrodynamical simulation is shown as a solid blue line. [Spake et al. 2021]
- The light curve is asymmetric and tapers off slower after transit than before transit, and
- The authors’ data extends further into the post-transit regime than Kirk et al.’s, which stops just as the planet has finished transiting.
What’s in a Tail?
The fact that there’s still absorption after WASP-107b has finished transiting leads the authors to infer that this planet actually has a tail: part of its atmosphere trails out behind it like a comet and escapes into space, causing us to measure the helium in its atmosphere even after WASP-107b is no longer in front of its host star! The existence of planetary tails has actually been predicted by hydrodynamical simulations — in fact, another group modeled WASP-107b’s atmosphere, and the resulting light curve (shown as a solid blue line in Figure 3) matches very closely with the data from this paper, corroborating the idea that WASP-107b has a planetary tail. The authors calculate that this tail extends out to 7 times WASP-107b’s radius, or roughly twice its Roche lobe radius — the longest tail ever observed at 10,830 Å.
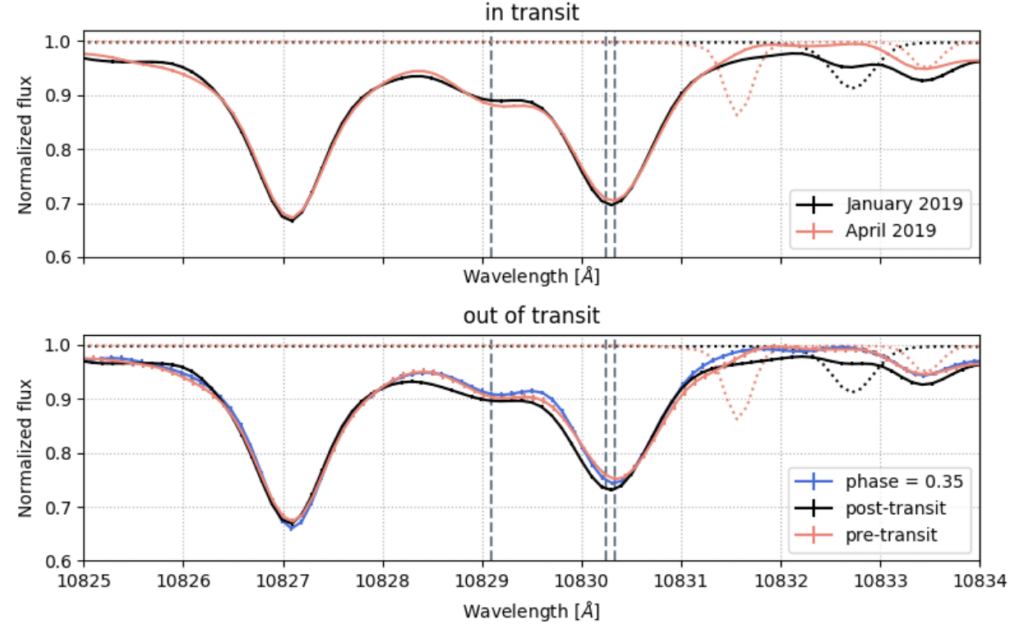
Figure 4: Comparing the in-transit (top) spectra to out-of-transit (bottom) spectra. For the in-transit spectra, the authors show the spectrum from their data (black) and Kirk et al.’s data (red). For the out-of-transit spectra, they show data points from the pre-transit of WASP-107b (from Kirk et al., red), its post-transit phase (from their data, black), and from their observations in April when the planet was outside the transit regime (blue). [Spake et al. 2021]
Though the authors also considered other potential reasons for why their spectrum differs from Kirk et al.’s, like WASP-107b passing over active or quiet regions of its star at different times, in the end they concluded that a post-transit tail is the best explanation. This result is an exciting step toward understanding how atmospheric escape works and what kinds of planets are more susceptible to it, and hopefully with more observations, we’ll be able to explore the effect of stellar winds on exoplanet atmospheres.
Original astrobite edited by Huei Sears.
About the author, Katya Gozman:
Hi! I’m a first year PhD student at the University of Michigan. I’m originally from the Northwest suburbs of Chicago and did my undergrad at the University of Chicago. There, my research primarily focused on gravitational lensing and galaxies while also dabbling in machine learning and neural networks. Nowadays I’m working on galaxy mergers and stellar halos, currently studying the spiral galaxy M94. I love doing astronomy outreach and frequently volunteer with a STEAM education non-profit in Wisconsin called Geneva Lake Astrophysics and STEAM.