
The flow of gas into and out of a galaxy regulates many of its features, such as its rate of star formation and chemical content. Computer simulations have allowed us to probe these gas flows in greater detail, but there still remains much to uncover. For example, on what scales does gas flow out of actively star-forming galaxies?
Outlining Galactic Outflows
Currently, computer simulations model the flows of gas leaving a galaxy, called galactic outflows, very generally. They are typically informed either by observations or large-scale physics. However, galactic outflows need to be modeled with much finer detail to grasp their full impact on galaxies, which means that observations of outflows need to probe much smaller scales than they currently do.
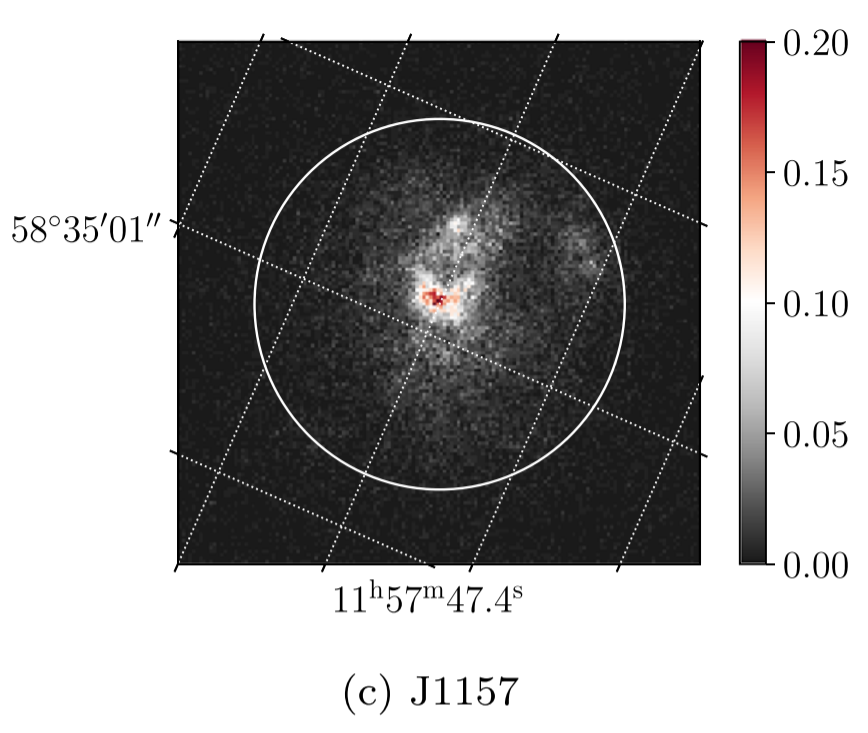
A near-ultraviolet image of the galaxy J1157 taken by the Hubble Space Telescope’s Cosmic Origins Spectrograph in acquisition mode. The white circle indicates the extent of the spectrograph’s imaging capability. [Wang et al. 2020]
To study outflow sizes, we need the flip side of absorption: emission. The material spewed out in galactic outflows fluoresces — it absorbs light at specific wavelengths and reemits it at longer wavelengths. A group of researchers led by Bingjie Wang (Johns Hopkins University) traced this emitted radiation from outflows in nearby starburst galaxies using data taken by the Hubble Space Telescope (HST). They then used this emission to explore the sizes of the outflows.
How to Trace an Outflow
Starburst galaxies have much higher rates of star formation than the average galaxy (for example, the Milky Way). This means that their outflows will also be much more prominent, along with the emission used to trace the outflows.

The ratio between the column density of the material within the radius studied by the Cosmic Origins Spectrograph (COS) and the total column density, plotted versus 𝛂, which quantifies how the density of outflow material depends on radius. The color bar shows the ratio between the radius of COS’s observations and the galaxy radius. The galaxies studied are plotted as well, showing that for this sample, 𝛂 is between 1 and 1.5. This means that the outflow contains more material further away from the galaxy. [Wang et al. 2020]
Line, Please!
Wang and collaborators found that the fluorescence lines are systematically weaker than the resonance absorption lines. This suggests that the fluorescence lines produced within the HST’s view are more often associated with the galaxy’s stationary interstellar medium or the slow-moving central parts of outflows, rather than tracing the fast-moving material in the outer regions of the outflows.
So where are the strong fluorescence lines? Wang and collaborators suggest that since outflows contain more material the further they are from the galaxy, the fluorescence would also appear further away from a galaxy’s center. However, the HST instrument used for this study is not equipped to observe very large areas, meaning that the regions with strong fluorescence likely lie outside of the instrument’s field of view and are being excluded from the data.
This result suggests that outflow rates for distant galaxies are significantly underestimated with the technique we’ve been using to measure them, and they do not account for changing strength with distance from the galaxy. One thing’s for certain: we’re going to need a bigger telescope.
Citation:
“A Systematic Study of Galactic Outflows via Fluorescence Emission: Implications for Their Size and Structure,” Bingjie Wang et al 2020 ApJ 894 149. doi:10.3847/1538-4357/ab88b4
2 Comments
Pingback: Śledzenie odpływów gazu z galaktyki gwiazdotwórczej – PTMA Kraków
Pingback: Śledzenie odpływów gazu z galaktyki gwiazdotwórczej – Astronomia Śląska