
We can only really see what’s going on at the surface of a star. However, the motions within stellar interiors show themselves as subtle variations in the star’s brightness, and with the dense observations of planet-finding missions, we can pick up these variations at very fine levels.
Brightness Changes
Asteroseismology uses different oscillation modes of a star to probe its internal structure and properties. [Tosaka]
Asteroseismology studies require stellar observations taken regularly over a long time. Luckily for astronomers, those are the same sort of observations required for the transit planet-finding method! Over the last decade, missions like Kepler and CoRoT have provided data that’s been used both to find planets and to characterize the insides of stars.
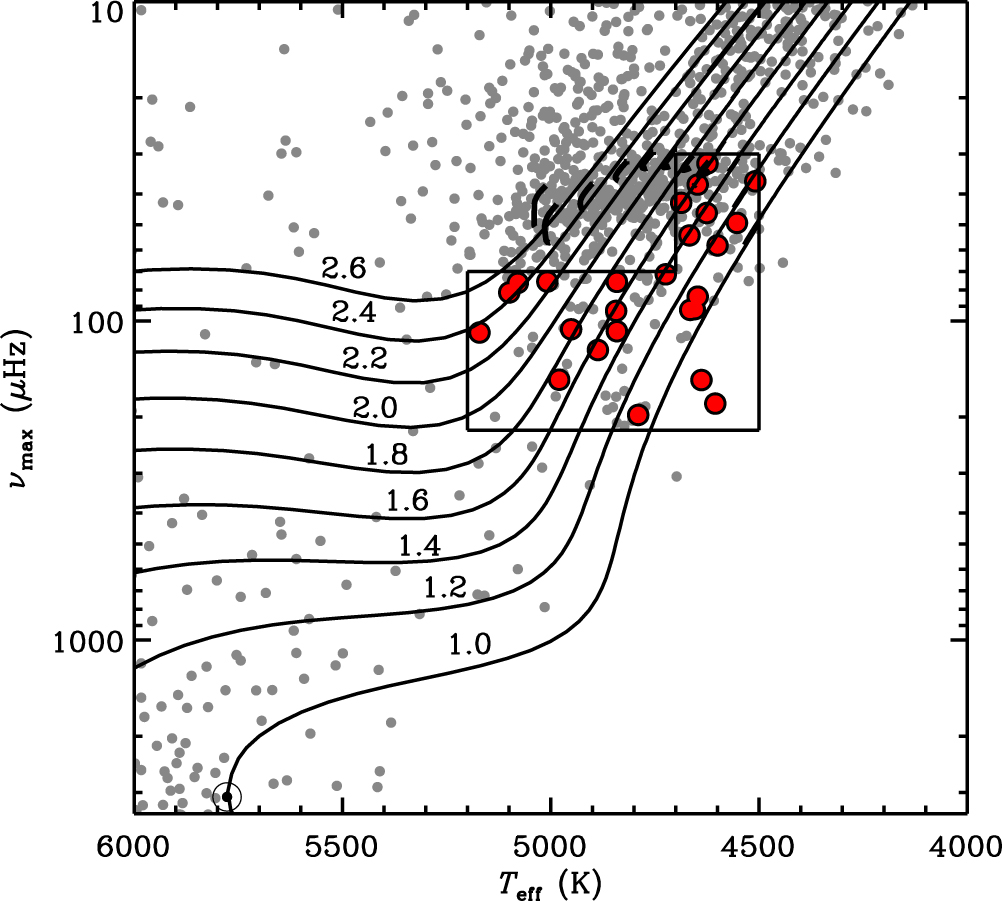
A Hertzspring-Russell (HR) diagram showing stars’ maximum oscillation frequency (instead of brightness) versus their temperature. The gray dots are all Hipparcos stars brighter than sixth magnitude, while the red dots are the red giant stars used in this study. The Sun is shown at the lower-left corner of the diagram. The tracks show evolutionary models for stars with the masses indicated (in solar-masses) [Aguirre et al. 2020].
So it makes sense to set up a framework to analyse TESS data in the context of stellar oscillations. Motivated by this, a group of scientists led by Víctor Silva Aguirre (Aarhus University, Denmark) carried out the first analysis of red giant star oscillations using TESS data.
TESS-ting for Frequencies
Aguirre and collaborators considered stars observed in TESS sectors 1 and 2 (not necessarily both) for their sample. They then used the Hipparcos astrometry mission catalog to identify red giant stars whose oscillations could be seen in TESS data. The maximum frequency of oscillations is set by a star’s temperature, mass, and brightness.
Assuming a mass of 1.2 solar masses for red giant stars (a reasonable assumption), the maximum frequency could be expected to fall between 30 and 220 µHz. From the available stars, the authors selected the twenty-five brightest stars for their oscillation analysis.
We’ve Got the Power (Frequency Spectrum)!
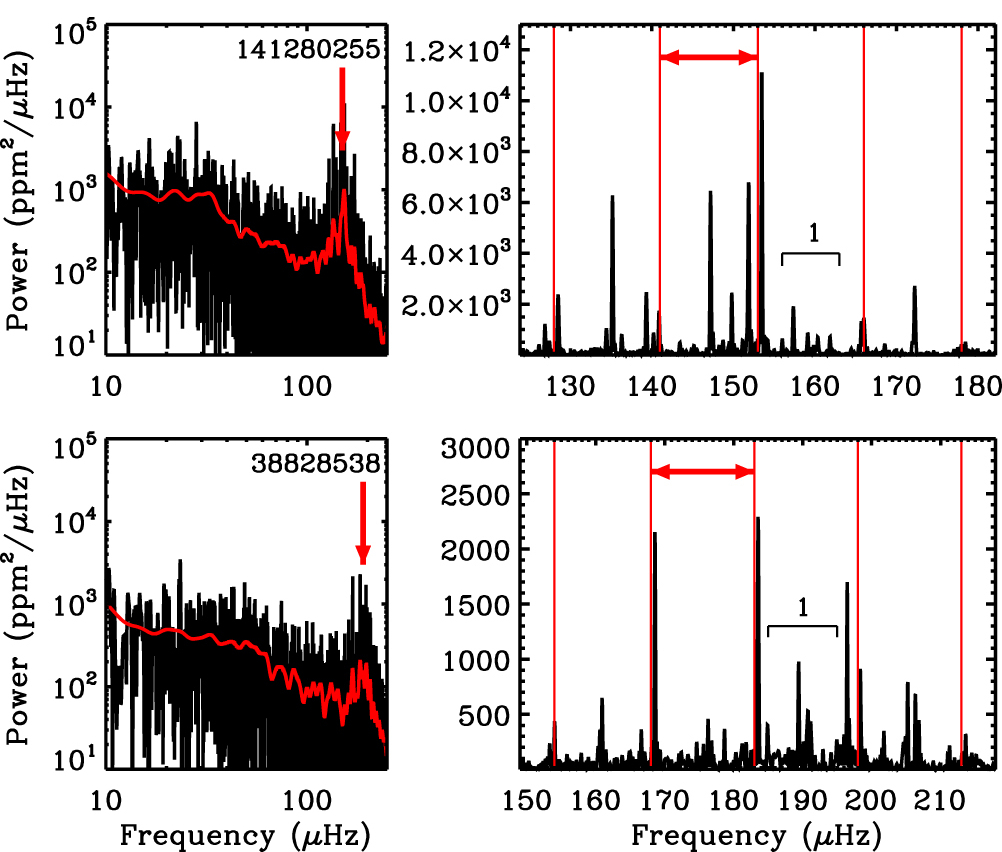
Representative power spectra obtained from the red giant light curves. The left panels have the spectra in log–log space, with the maximum frequency distinguished by the vertical arrow. The right panels show a close-up of the power spectra showing frequencies associated with particular oscillations. The separation between those dominant frequencies is shown using the red vertical lines with the horizontal arrow showing the average separation [Adapted from Aguirre et al. 2020].
By combining the oscillation frequency information with astrometry data from the Gaia mission, Aguirre and collaborators showed that they could measure the properties of these red giants to high precision levels — stellar radii can be determined to a precision of a few percent, masses to 5%–10%, and ages to around 20%.
With the incoming flood of TESS and Gaia data, we will almost certainly be able to characterize red giant stars better than we have in the past. And this is to say nothing of what will come out of TESS’s extended mission, beginning July 2020!
Citation
“Detection and Characterization of Oscillating Red Giants: First Results from the TESS Satellite,” Víctor Silva Aguirre et al 2020 ApJL 889 L34. https://doi.org/10.3847/2041-8213/ab6443
4 Comments
Pingback: Mirando el interior de las estrellas – Observatori Astronòmic
Pingback: Mirando el interior de las estrellas « SEDA / LIADA - RedLIADA - Cursos LIADA - Cielo del Mes - Fenómenos Astronómicos - RELEA
Pingback: Mirando el interior de las estrellas « Sección de Astrofísica de la LIADA
Pingback: CO8 – Joliet Junior College – Astronomy 101 class blog